Hi again Seeking Light,
If possible, could you elaborate a bit on this statement "above 109 I want to see a bit more of price behavior first"
Does that mean you are willing to short between 108 and 109 without pa confirmation? I doubt the answer to be yes so my question is really what pa would be enough to sell between 108-109 but not above it? I hope you understand me.... Thanks Sebastien
Ignored
Hey Sebastien.
Like you wrote what I meant to say was not that I would short without any kind of price action. It simply means that beyond a certain point in price levels I would be very hesitant to "trust" the bearish potential, unless there was a really good sign in the way that price reacted or how the bars formed that told me, okay, we're back selling with full confidence.
Basically I currently think that we are getting very very close on some pairs to critical levels like the one raczekfx just posted.
Beyond a certain point the downward moves are essentially negated for me and the bias either shifts or becomes unclear.
And once the outlook becomes unclear I need something to help me feel like I know what is going to happen next again. I look to price.
I hope this explains little bit. I know it sounds very complicated, but it's a little bit like building a relationship. There's got to be a mutual trading of trust for things to go somewhere together, otherwise one of the two will always want to go one way while the other goes the other way and that's not good for the account.
Joined Jul 2006
|
Status: Charts + PA > *
|3,251 Posts
USDCAD chart since I just read about CPI speculation("CAD may spell opportunity" - well yea, it already did...price comes first and unlike the news outcome, this one said ahead of time where it would go once past the lows of the bars. I really don't like all this baseless "oh look a news number is upcoming, there may or not be a move coming that could take all this a lot lower" speculation - because there's no need to speculate if you can just listen to what the chart is saying. We do not gamble our money away, we do not speculate on news. We trade price. Well, that's what I believe we're trying to do anyhow ;p)
This imho is how you could have viewed(and traded with PA) the USDCAD(and EURUSD, GBPUSD...etc pp. It's a bit annoying when all charts show the same thing because it's simply a mirror image of the DJI..makes it all feel very un-unique.).
BEOB signals an interim high may be reached, IB means market is trying to think hard about whether it wants to hold or lose that s/r of the prior high, then gives up with a sigh, falls to prior s/r area(breaks down BEOB and IB).
No indicators, no news, no fundamentals. Chart and price.
If you look closely you can see how similiar the last part of the trending channel is to other bigger channels like the daily GBPUSD one or other pairs that trended like that and then started to contest and lose their channel.
I was using price action with only MA's. But now i got keltner channel which has following field -
MA_Period
MA_Mode
Price_Mode
ATR_Period
K
ATR_Mode (default value is false of Atr_mode).
James sir already told about keltner channel setting. But i donot know how to set it please help.
Iam attaching indicator also.
Ignored
I'd like to bump this post if you don't mind, does anyone know where to plug in the "8,1.3,1.3" that james spoke of in reference to his Keltner Bands?
I'm relatively new to candlesticks and price action though this what I see. Your comments are appreciated.
Ignored
Hi Jor.
To add to Mikes post, heres some trade considerations.
Good pin, in a lower grade position.
Would be a good candidate for a trade, but...
Pros: *Strong bounce off of a fibonacci confluence area. Shows a good reversal of sentiment during that bar. *Nice looking pin, all out by itself. i.e. not sunken within the previous price action. *We know we are in a strong downtrend and that we have possibly just had a small rally. ( a weak 'pro'! LOL)
Cons: *We've been heading down for a while and have now hit long term moving averages and support/resistance areas. *It's coming not long after a strong reversal upwards (Shown by the arrow below.)
On the 4 hour chart you can see a definite double bottom (chart 2).
If this had revealed itself as a daily pin going the OTHER way AND at the bottom of that previous downtrend, it'd be a very high grade pin.(as explained in chart 1)
*Possible support from top of double bottom 'centre' rally high.(blue line on chart 2) *Possible support from down sloping trend lines. One likely line shown on chart 2. here?
It (the pin) still has it's significance, but the prospects for a good run are lower.
Even because of that , I'd be looking to get out quickly, or at least cover my costs quickly.
A valid trade maybe to aim for the Ellipse area in chart 2. THAT'S IF our risk/reward adds up.
What worries me here is that horizontal area (blue line) above the double bottom. There's not enough room between our current position and there, 120 pips, and your stop on the otherside of the pin at 230 pips!! You are risking twice of what you'll have if we don't get past that support.
It's the double bottom that's really made this a scarier trade to me. Otherwise I'd have no qualms about aiming for that blue Ellipse area.
The pin MAY signify a continuation down, but after all this, there are higher probability trades out there. UNLESS we get a deep retrace into that pin on Monday which we can use to improve the RISK/REWARD ratio. Even then, it's not the best.
It's a pity as I'd love to play for the ellipse.
But hey. As traders we are all about waiting for the best oppurtunities.
Joined Feb 2006
|
Status: 'Try-hard' extraordinaire...
|2,151 Posts
I said I'd give a more details on this trade later on, so here it is with promised pic.
This trade was playing the recovery from the worst stock market fall in a long time here in Oz. It hurts a little knowing it reached the %61.8 retracement of the last down wave in the fall. : ...The exact top of this weeks action. This was actually the target I had in mind!! LOL There is a major reaction here most of the time. Even if there is a continuation later on.
Pity I had to leave yesterday.
As you can see, even on the 15 minute chart, at NO point was there any reason to get out of this trade until the %61.8 was met!
When I closed off yesterday I took a quick visual look and thought we were at the double bottom trade target anyway. Which we weren't! Optical illusion!!
If you are near the trading screen ,you normally would watch how the price bars develop. Getting out only when they tell you to. Preferably on the higher time frames. Keeping track of major target zones.
In the end, the run from entry was a very respectable 440 points. From a trade that risked 17 points. Would have been nice.
I got 200. Still. At better than 10 to 1 Profit/Risk no-ones complaining!
The daily chart on this now shows a pinbar down. It's a funny chart though, as the daily only appears to take into account out of australian trading time data. It does, though, look like at a least a retracement is on the cards. .....We'll see.
Ya'll have a good weekend.
To all fellow Aussies.... HAPPY AUSTRALIA DAY!! Enjoy your barbies and booze, days out , or whatever you are doing today.
and a nice fall of 200ps...back to S/R... you got to love it.
Ignored
I agree with a short, but this one will have to be monitored VERY carefully. I made out nicely with that double bottom on 4H... but double bottoms throwback to the apex 55% of the time. So it's a coin toss.
But the interesting part is that if you look at most chart patterns, whenever there is a throwback, you have around a 85% chance it will recover and resume.
So I'm not putting too much significance on this pin to be honest. I'm still looking for a pullback to our H&S neckline at the 217 area... then we can talk about heading back down.
|
Joined Oct 2006
|
Status: Britunculus
|940 Posts
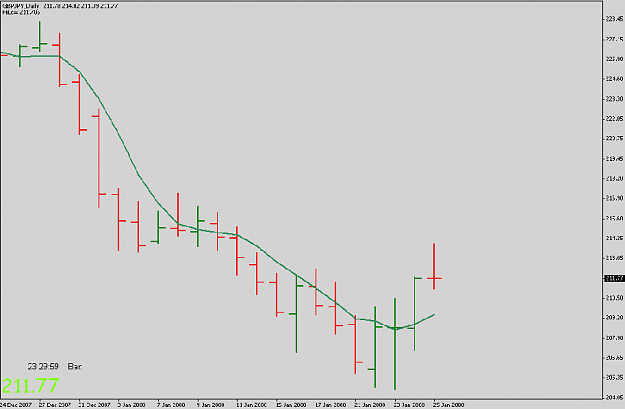
Well I know how you guys love to keep it simple here. Which is great btw.
So I thought I would show you a chart setup I found over on the MoneyTec forum.
As far as I can see this is a serious setup.
Enjoy...
Well I know how you guys love to keep it simple here. Which is great btw.
So I thought I would show you a chart setup I found over on the MoneyTec forum.
As far as I can see this is a serious setup.
Enjoy...
Ignored
LOL. haha
I have no idea what that "chart" is showing.
You need a microscope to see what's going on.
I can't believe people can trade like that.
Nevertheless, I agree with the trades... :
Well I know how you guys love to keep it simple here. Which is great btw.
So I thought I would show you a chart setup I found over on the MoneyTec forum.
As far as I can see this is a serious setup.
Enjoy...
For anyone still having trouble with the temptation to trade 'faster' on the shorter time frames , I have one good tip!
Grab a notepad and draw up two columns.
Mark one 'Profit', and one 'Loss'. (...believe me, this is worth it. )
Scroll through the various time frames counting pinbars.
Put a mark in the 'Good' column whenever a pin is followed by a useful/profitable move. Mark the other column whenever the pin is a failure. Ignore pins that you know (Or SHOULD know) are in the wrong place. i.e. Bearish pin in the MIDDLE of a down move etc.
This wont take as long as you think it might and it's extremely worth it. Do this for Dailies, 4 Hourlies, 1 Hourlies and 15 minute charts. Go through say 6 months to a year on the hourly, 1 - 2 years on the 4 hour etc. You don't need to go through a mind numbing amount of history to get the point.
You'll get a great insight into why the smaller time frames are very much a case of playing with fire.
As a bonus, you'll also be elightened as to why money management and risk are such a vital ingredient in becoming successful. Anything below 1 hour screws with your odds. You don't particulary need that!!
(Speaking of odds. Try this if you like... Do the same again for one of your hourly charts, but this time, use a complementry bar/candle as a filter. i.e. wait for a bearish bar after a bearish pin. One that breaks the pin's low. Taking the best ones that haven't moved too far . Watch what difference that can make to your odds.)
And that's BEFORE adding confluence etc!
If you think this contradicts my statements on 15 min charts in a few posts I've got here. ...Well... ....Yeah. It does!! LOL
....Honestly. I get away with it only through LOTS of screen time being clocked up and it's more hard work than any of us probably needs. ....Currencies and the 15 min / 5- min charts always seem a LOT harder than in other markets too. If you aren't in the habit, keep it that way!
Another thing Seeks touched on in his post above. Don't trade against a weekly pin. ...Not just that.... Trading from the top charts down is always a good move. You'll see possible support resistance clearer for starters. I made this mistake late last week. Not leaving anough room for a trade to get into profit quickly. (GBP/JPY is STILL scurrying around the same support area!)
Cheers,
B
Ignored
Okay.....that was pretty convincing! Good post.
Capital Preservation is key to long term wealth accumulation