[quote=GridTrader;1819334]@Skunny: I know you're busy, but... It seems there were quite a few people here that took this GJ trade that happened to fail going short (see chart). The only things I could see in this chart was that the weekly target had already been reached, price breached the weekly low and traded below it again, and that this was a smaller trade within a larger range.
GT,
I'm definately not Skunny Sensi, he's got the real answers, but I was also looking for this to go further down. What I noticed, is the same thing I have noticed at other times when the market was about to turn. First, on a small timeframe, fibs start to activate and then fail to reach their targets. You may see this 5 or 6 times in a row and at the same time you'll have larger time frame fib(s) fail as well. The failed fibs then activate and complete on the other side and price moves in that direction. This allows you to see (on a micro level if you will) the market changing direction. This happened three times last night when the market reached the lows. I didn't save my fibs, as it gets way too messy when you keep those small time frames on the chart as it moves. And I'll reiterate something that Issy said earlier, that it is best not to get focused on the smaller timeframes, but it helps to see what is really going on, especially when the market stalls. Hope this helps.
@Skunny: I know you're busy, but... It seems there were quite a few people here that took this GJ trade that happened to fail going short (see chart). The only things I could see in this chart was that the weekly target had already been reached, price breached the weekly low and traded below it again, and that this was a smaller trade within a larger range.
GT,
I'm definately not Skunny Sensi, he's got the real answers, but I was also looking for this to go further down. What I noticed, is the same thing I have noticed at other times when the market was about to turn. First, on a small timeframe, fibs start to activate and then fail to reach their targets. You may see this 5 or 6 times in a row and at the same time you'll have larger time frame fib(s) fail as well. The failed fibs then activate and complete on the other side and price moves in that direction. This allows you to see (on a micro level if you will) the market changing direction. This happened three times last night when the market reached the lows. I didn't save my fibs, as it gets way too messy when you keep those small time frames on the chart as it moves. And I'll reiterate something that Issy said earlier, that it is best not to get focused on the smaller timeframes, but it helps to see what is really going on, especially when the market stalls. Hope this helps.
Ignored
did u guys read my last post? maybe this is the answer...if u like i will tell u my theory and u all can test it...boy i m glad i wasnt short there... he he
I'm definately not Skunny Sensi, he's got the real answers, but I was also looking for this to go further down. What I noticed, is the same thing I have noticed at other times when the market was about to turn. First, on a small timeframe, fibs start to activate and then fail to reach their targets. You may see this 5 or 6 times in a row and at the same time you'll have larger time frame fib(s) fail as well. The failed fibs then activate and complete on the other side and price moves in that direction. This allows you to see (on a micro level if you will) the market changing direction. This happened three times last night when the market reached the lows. I didn't save my fibs, as it gets way too messy when you keep those small time frames on the chart as it moves. And I'll reiterate something that Issy said earlier, that it is best not to get focused on the smaller timeframes, but it helps to see what is really going on, especially when the market stalls. Hope this helps.
did u guys read my last post? maybe this is the answer...if u like i will tell u my theory and u all can test it...boy i m glad i wasnt short there... he he
Ignored
I'm all ears. Hold nothing back.
The market is like the matrix - it is you that must learn to bend
Sizz what would you consider a valid completed swing. Only drawing (walking) off one that previously hit it's target?
It was simply a trade within a larger trade set up. As I mentioned before, there was a larger swing range in place, but the smaller ones within work well too. Just not this time.
Hmmm. Okay. I think I can make sense of this. I'm not the only one here who seen this a valid trade, so I am sure others here will benefit from the comments. P.S. Thanks for the notes on the chart!! Really helps when saving pics to recap on at a later date.
Ignored
Grid,
Me explain something logically? You might have more luck getting a giraffe to belt out pavarotti. IF you do, I will pay good money to see it If you can do that I would like a chimp that freestyle raps too.
Did you look at the 4hr? Did you look at 15 minute? I wait for price to stop going up or down and reverse basically and I look to different tfs.
@Skunny: I know you're busy, but... It seems there were quite a few people here that took this GJ trade that happened to fail going short (see chart). The only things I could see in this chart was that the weekly target had already been reached, price breached the weekly low and traded below it again, and that this was a smaller trade within a larger range.
You said before that if a trade failed, "please post the chart so someone could look at it". Could you please give us some guidance, or a possible reason as to why this one didn't work out like several here had expected?
Much appreciated!
GT (Jon)
@Pipo: Curious if you were fibbing this chart too? If so, could you kindly share with us how you walked your fibs during the process?
Thanks!
Ignored
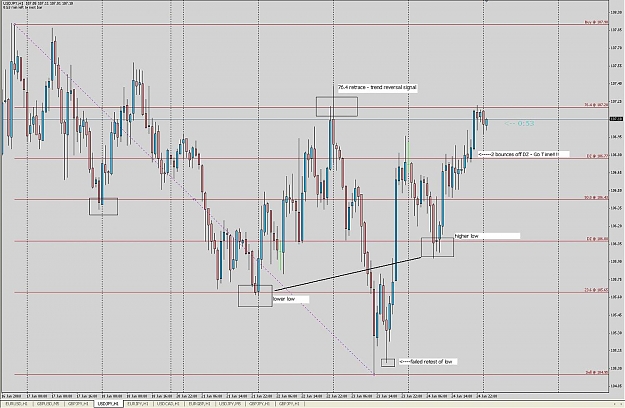
Hey Grid, thanks for using my chart as an example of a failed fib
But seriously... I think me - and some others - have been impatient to draw a fib and to trade. So we used the small swing yesterday to find a fib opportunity for the sake of it.
But as sizzler and pippro showed... this move was a move inside a bigger swing.
So here, when fibbing just the visually obvious swings (and not everything that comes across) our swing was just a retrace to the inner 61.8, followed by a 38 extension hit and reaching some pips shy of the 62 extension.
And as the bigger swing (shown below) wasn't finished yet, there was no reason to draw a new, smaller one.
So as I have no more indis on my platform... now it's just the patience I have to acquire!
Any comments?
Attached Image (click to enlarge)
"The only successful substitute for brains is silence."
See attached chart for the set up I had in place for whichever way the trade developed. It looked to me as if it was going long based on previous hint.
P.S. I know this stuff can be confusing, but the longer you watch the fibs and realize there are other motives around (weekly and daily targets) the more you play out the moves in your head. You come up with scenarios and when one of those begins to play out its like a road map telling you where to trade. I try not to trade until then.
Ignored
Thanks for the eye opener PiprPro
If I could have just looked at that multi day hrly chart in the same way I was looking at the 1M & 5M charts while in that short trade I would have been able to see I was in a possible retracement bounce zone on a larger scale.
@Skunny: I know you're busy, but... It seems there were quite a few people here that took this GJ trade that happened to fail going short (see chart). The only things I could see in this chart was that the weekly target had already been reached, price breached the weekly low and traded below it again, and that this was a smaller trade within a larger range.
You said before that if a trade failed, "please post the chart so someone could look at it". Could you please give us some guidance, or a possible reason as to why this one didn't work out like several here had expected?
Much appreciated!
GT (Jon)
@Pipo: Curious if you were fibbing this chart too? If so, could you kindly share with us how you walked your fibs during the process?
Thanks!
Ignored
To all those that commented to my post above. The UJ 1HR chart (attached below) had the same movements as the failed trade on GJ. Only difference was that UJ hit it's target. So though I agree that everyone is looking from different angles and saying this or that, which is all good stuff (so don't get me wrong here), the truth for me is one trade worked out and the other did not. So perhaps this is what Skunny meant when he said
...But what if in order to be "perfect and flawless" you've passed on 30 trades and of those 30 you would have messed up 15% of them due to your own buffoonery, not your system? Of those 30 trades you would have netted 2000 pips. Now does it make sense to only take the supposed "perfect flawless trade"?...
Ignored
EDIT: 2nd chart added (drew the wrong swing) but even still only 2 pips from UJ target.
Attached Image(s) (click to enlarge)
The market is like the matrix - it is you that must learn to bend
Hey Grid, thanks for using my chart as an example of a failed fib
But seriously... I think me - and some others - have been impatient to draw a fib and to trade. So we used the small swing yesterday to find a fib opportunity for the sake of it.
But as sizzler and pippro showed... this move was a move inside a bigger swing.
So here, when fibbing just the visually obvious swings (and not everything that comes across) our swing was just a retrace to the inner 61.8, followed by a 38 extension hit and reaching some pips shy of the 62 extension.
And as the bigger swing (shown below) wasn't finished yet, there was no reason to draw a new, smaller one.
So as I have no more indis on my platform... now it's just the patience I have to acquire!
Any comments?
Ignored
I was at work so I had to use your chart. Of course I had one drawn the same . IMO, a move inside a bigger move is not so bad though, as long as the target of the smaller swing does not exceed the boundaries of the larger swing targets. Please sombody disagree and tell me why this is not good. Did not Skunny show a statement that included both shorts and longs, and did he not mention trading in hedge fashion? So opposite direction was present and my guess is that he takes the smaller trades too. Recall the posts of him grabbing just a few pips off a 2 bar fib? Sorry to ramble on here. Everyone has made valid points, but I don't think a smaller swing trade within a bigger one is wrong. If that was true, then why trade 1HR when we are looking at weekly fibs? Am I making any sense?
The market is like the matrix - it is you that must learn to bend
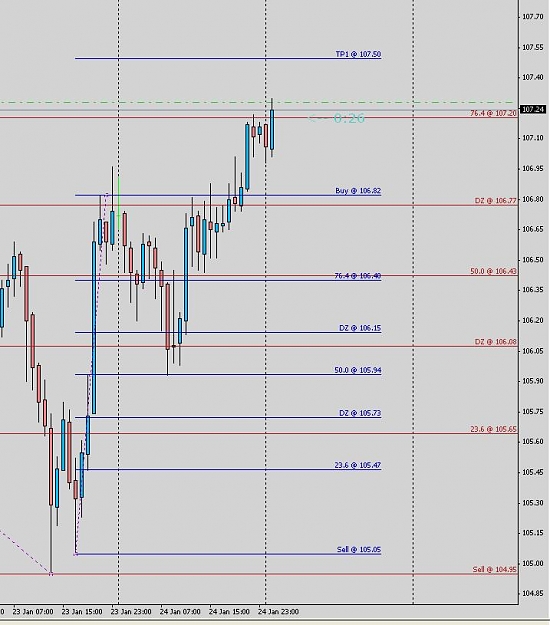
I went and zoomed out on the U/J 1HR chart and I see the U/J set up was identical to the alleged G/Y failure. All the signs were there for a trend reversal.
*** edit, so now with the new fib TP1 should be at 107.50 .....we'll see ***
I was at work so I had to use your chart. Of course I had one drawn the same . IMO, a move inside a bigger move is not so bad though, as long as the target of the smaller swing does not exceed the boundaries of the larger swing targets. Please sombody disagree and tell me why this is not good. Did not Skunny show a statement that included both shorts and longs, and did he not mention trading in hedge fashion? So opposite direction was present and my guess is that he takes the smaller trades too. Recall the posts of him grabbing just a few pips off a 2 bar fib? Sorry to ramble on here. Everyone has made valid points, but I don't think a smaller swing trade within a bigger one is wrong. If that was true, then why trade 1HR when we are looking at weekly fibs? Am I making any sense?
Ignored
Good point!
Guess we just have to live with the 5% of fibs not working out
"The only successful substitute for brains is silence."
I really enjoy reading everyones analysis. (even when it's not correct)
Ignored
Crud!!
And I was kinda hoping that at some point, you were gonna give us some insight into whose analysis was more "correct" than "not correct" so as to help us all stay on the straight-and-narrow.
Now, in light of the Emailer's revelations........we may all have to go find some system on Ebay!
Or.....
....at least you might give us the Emailer's name so we could go find his thread and learn the right way to do things....
Hey Grid, thanks for using my chart as an example of a failed fib
But seriously... I think me - and some others - have been impatient to draw a fib and to trade. So we used the small swing yesterday to find a fib opportunity for the sake of it.
But as sizzler and pippro showed... this move was a move inside a bigger swing.
So here, when fibbing just the visually obvious swings (and not everything that comes across) our swing was just a retrace to the inner 61.8, followed by a 38 extension hit and reaching some pips shy of the 62 extension.
And as the bigger swing (shown below) wasn't finished yet, there was no reason to draw a new, smaller one.
So as I have no more indis on my platform... now it's just the patience I have to acquire!
Any comments?
Ignored
Dx,
Your colors make me happy like easter I didn;t have that swing
I was in one still from the last high that has me targeting 212.75 active I have a bunch of smaller Tf fibs up that swing. This is my last fib on that swing Lowell and I went through it live but didn;'t trade. BOO!
Actually all this talk..there IS a fib in there Grid Dx..surprise! hehehe ( this is just the first one I saw I am sure there are more)
there is a little 40 some pipper it is just hiding prolly cuz it is ugly
. Check your tf's. These darn things are everywhere. You have to start reading pa like a fiend though to find s/r IMO. so far ...still testing. , this is still non discretional as fits my testing
Sometimes there won;t be one on the one hour yet so you have to wait or bounce around until the market shows you one.
Sizz.
Also,,, Issy... you see these charts? hehehe I am PARCHED! hehehe j/k
Edit I am a chart pig OINK I threw in a E/j for you issy so we can see another cross and not thnk GY has all the fun.
I dunno if that last one will turn out still testing. The first one was courtesy of mr Ian who reminded me to scale out thanks Ian
WISH these stupid cross pairs were pip perfect ..... hehehehe
ok I will let it go I don;t want to walk the plank! of course this will blow up
I went and zoomed out on the U/J 1HR chart and I see the U/J set up was identical to the alleged G/Y failure. All the signs were there for a trend reversal.
*** edit, so now with the new fib TP1 should be at 107.50 .....we'll see ***
Ignored
Well it's becoming obvious that I don't know as much as I thought I did in regards to reading price. And why is the 76.4 retracement level (piphitmans chart) so important? Most here don't use that level as far as I am aware. The 161.8% is also said to be an ideal reversal point, but that doesn't always work out either, and time frames do differ. I could really use some pointers here on studying S/R. Yes PiprPro, this can be confusing. I do look at the charts (and quite a bit actually). Remember I'm the guy that has dreams at night where I'm trading! LOL. I don't want to hog all the posts (forgive me everyone). PiprPro, do you think you could briefly re-comment your chart with my questions written on it?
Thanks all.
Attached Image (click to enlarge)
The market is like the matrix - it is you that must learn to bend
I was at work so I had to use your chart. Of course I had one drawn the same . IMO, a move inside a bigger move is not so bad though, as long as the target of the smaller swing does not exceed the boundaries of the larger swing targets. Please sombody disagree and tell me why this is not good. Did not Skunny show a statement that included both shorts and longs, and did he not mention trading in hedge fashion? So opposite direction was present and my guess is that he takes the smaller trades too. Recall the posts of him grabbing just a few pips off a 2 bar fib? Sorry to ramble on here. Everyone has made valid points, but I don't think a smaller swing trade within a bigger one is wrong. If that was true, then why trade 1HR when we are looking at weekly fibs? Am I making any sense?
Ignored
GridTrader
Thank you, these are the things I remember also when drawing my fibs. That is how you handle the draw downs, and Skunny talked about taking trades that were 3 times the spread. I know most are only looking at the fibs that follow the trend, but I believe there is more to the overall picture. Skunny, PLEASE, correct me if I'm wrong.
Mom
"To conquer fear is the beginning of wisdom." – Bertrand Russell
Well it's becoming obvious that I don't know as much as I thought I did in regards to reading price. And why is the 76.4 retracement level (piphitmans chart) so important? Most here don't use that level as far as I am aware. The 161.8% is also said to be an ideal reversal point, but that doesn't always work out either, and time frames do differ. I could really use some pointers here on studying S/R. Yes PiprPro, this can be confusing. I do look at the charts (and quite a bit actually). Remember I'm the guy that has dreams at night where I'm trading! LOL. I don't want to hog all the posts (forgive me everyone). PiprPro, do you think you could briefly re-comment your chart with my questions written on it?
Thanks all.
Ignored
Someone more wise in the ways of fibonacci recenty told me that when price hits a bottom and starts to retrace upwards it will usually hit the 38, 50, or the 62 before bouncing back down, if it goes all the way up and hits all the way back up to the 76.4 area that is not a "normal" retracement and may signal a trend reversal.......I said "may".
I learned a lot looking at Issy charts and study very closely what happens in between the DZ (decision zones) 38 and 62 area.
Also (with permission from our gracious know nothing host) I would like to post my favorite all time chart post of Skunny's.
I have looked at and studied this chart even more recently upon my AHA !! moments of fib bounces inside the DZ. Look at this one really closely and examine each and every candle and where it bounces when inside the DZ. I can now see where the Skunnster entered his trades at the 62, 50, and 38 lines before it even got to the 0/100 entry line.
p.s. someone please correct me if my thinking is wrong on the abnormal retracement areas (76 or 24)
Just kidding - I believe the Monthly Fib belongs where everyone had it, but what if? When targets are attained it's time to play Tarzan and start swinging the fibs.