Yes howard. They are still active. But they are in vacation in the US today until wednesday. So if you do not receive a confirmation email by thursday, try registering again.
The buy on support @1.4520 gave a bounce to 1.4560, the WS1 and Daily S1 resistance, and it was easy here to close and reverse the position targeting 1.4525 again.
The sell of the break @1.4520 has seen it's first target hit @1.4465. Moving SL to BE and going now to target 2.
Ignored
The sell of the break @1.4520 has seen it's second target hit @1.4380. Moving SL to 1.4470 and going now to target 3 @1.4315
Joined Dec 2006
|
Status: Learn, share and grow!
|580 Posts
What a Big Dog Play we witnessed in the 7 past days.
We first wintness a sudden down move from 1.48xx to 1.43xx in 4 open days, with no reason but a certain claim that the crisis in the US market may reach Europe.
It appeared today that this manipulation had only the goal of suddenly cutting .75 of the interest rate in the US as they did today. We witnessed an almost 300 pips move today! EU will still go higher, but does not seem to have the strenght to break the all time high even with the expectation of another .50 cut next week. At least it seems that this is the goal of the BD, and in this view, if ever the EU approach these levels next week before the cut, they will probably not cut or only cut .25 to avoid a dicisive break to the up.
And once the market absorb the chock of these cuts, it will go down to break the 1.43 opening the way to 1.4 and 1.37 levels.
I will be looking for good oportunities to go short for long term positions in the coming days, unless EU manages to break 1.5
Ignored
if fed cut 0.50% again, 1.50 its just a given.
after 1.50 is hit, expect banks around the world to dump usd like crazy.
still the view in the market is fed is a step ahead of other banks and probably thats giving some support to usd. if not, an USD minicrash is possible.
Could you inform us about your thoughts on Session personalities? I would highly appreciate it.
Regards,
Ignored
We have three main sessions in the Forex market: The Asian, the London and the NY session.
Every session has its own 'personality'. Since every pair has it's own 'personality' too, we'll have many different kind of behavior taking these combinations into consideration.
EU is the most traded pair and I will give some leads about it in relation with the different session as I see it:
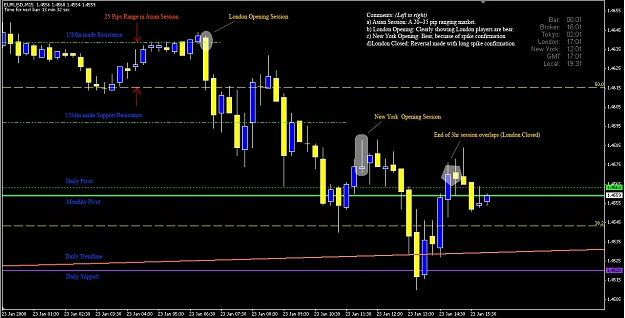
Asian session: In general, EU tends to play during Asian session in a 20-35 pips range, depending on the previous session volatility.
But, if we have witnessed very high volatility during the previous sessions as we did yesterday, it can continue to trend more. We witnessed the last All time peak high during this session, with a 100 pips break up, when most traders where sleeping, after some high volatility days. It was directly followed by a 150 pips counter move on London open.
London session: It is more driven by technical factors for the first 2-3-hours. Main news will come around 9:00 GMT for EU and 9:30 GMT for GU but will affect both pairs and the related ones.
NY Session: It is more driven by News at 13:30 GMT, 30 minutes after opening, sometimes followed by more news at 15:00 GMT. Most news trader are active at these times.
This session often counter balance the London move when the markets are ranging.
We witness in general lot of volatility for the main 3 hours where both London and NY sessions overlap.
The opening and close of every session give some moves that can be traded too.
|
Joined Sep 2007
|
Status: Bored Trader
|201 Posts
Following is what I have learned from Mr. Hani & others. It's a combination of Main Supports/Resistances + Fibo + Candle Patterns & Pivots.
If you watch out for the important news, when they come, and Try to control your emotions by starting from very low capital risk with patients and than grow it by a plan:
YOU WILL BE SURE A BIG WINNER.
BUT I would say the most biggest winner is who learns, shares & grows.
Thank you.
Mohammad
Ignored
As usual, you learned very fast because you have an open minded.
Very neat post and chart without all these 'useless' uncountable indicators. This shows that you understand well the rhythm and the 'emotion' of the market.
I propose you post the same chart updated at the end of london session if you can. This will show how effective what you are saying is.
Continue the good work and wish you plenty of pips.
Chart attached. Kindly check & add your comments if needed.
Regards,
Ignored
Nice chart and comments.
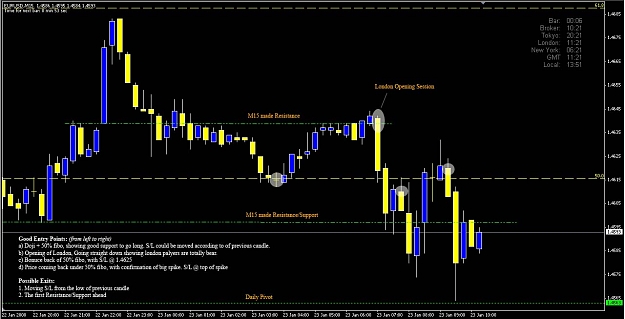
The bear move started at the London session continued in the NY session since there were no fondamental news and both sessions were driven by technical factors. So EU did bounce on the expected support @1.4520 back to the Pivot line where it is trading right now.
Buying 'blindly' at this good support level would have given an easy 40 pips with a 1:2 R:R (20 pips risk, 40 pips award)
We can expect calm trading now, maybe some small moves around NY close.
Good time to take a rest and prepare tomorrow trading.
Well done Khanderoo.
The question would remain, how have you done in your trading today?
|
Joined Sep 2007
|
Status: Bored Trader
|201 Posts
I have started with only risking 0.1% of my trading capital on each trade. My goals are as follow:
1. 1st week trading:
a. Add positive percentage to my balance each day.
b. Targeting only 25 pips/day & the rest paper trading.
c. Maximum two trade per day & analyzing my emotions.
- So far 3/5 has passed with success. If totally passed it will give me confidence on my trading style while I observe my emotions & try to control them by my mind. If not passed, I will analyze what I have done & try again.
2. 1st month trading:
a. Adding positive percentage to my balance each week.
b. Targeting only 25 pips/day & the rest paper trading.
-Looking to put this trading style deep in my unconscious mind with powerful confidence & pip results and without any emotional balance growing (to kill the greed)
3. The Next Months:
a. doubling the risk on my trading capital (0.2%,0.4%,...)
b. Trying to perform like the previous month.
c. If succeeded, repeating this step. If not, Going one step
back & trying again.
d. My previous month equity would be a cut for my drawdown.
-By this plan, I will grow my risk under complete control & if failed to control my emotions, there will be a step back to were I can control it.
-Also if I could keep up the good work (without your help this was impossible), I will have a continuousexponentially growing balance. And this is the reward for patience.
I would be thankful if you add your suggestions to this plan.
Regards,
Ignored
Very nice presentation Khanderoo.
It is well done and structured in good successful steps.
I would just advise younot to systematically double your risk every month as proposed in step 3, but increment progressively by 0.1%
Indeed, when you double your risk, you will fall in the trap of fear and discouragement as soon as you get 2 or 3 losses in a row, as the losses will be more than the wins your mind is used to get the previous month, and fear will come back in force. And you will start doubting about your abilities, the system you are using and the way you are trading.
I know this will take double time to get to 1% or 2% risk per trade, but as you know, patience pays...
1) I draw all R/S form 1day(TF) to 15m(TF); If useful, i also draw various trandlines to identify the trends
2) I draw fib lines in two ways: In the classic way i see the possible bounce(and if they coincide with S/R); In the second way I see the possible intermezzo targets ( u can see it in the chart below)
3) i look for some bear/bearish candle-pattern in the place of possible bounce (ex: on S/R, Trendlines etc.), and i wait: that the minimum/maximum of this candle is overcome (about entry)
4)the exit is based on targets or on a trailing stops (on the minimum of the preceding candle)
--------------------------- ABOUT CHART BELOW:
Circle: entry
Green lines: main S/R
orange lines: fib (classic way)
red lines: fib (possible targets) ,( i do not know say in english how i draw them, but i take in consideration small s/r and range)
ps: probably i did not take the setup in blue circle becouse was under support and the candle-pattern was not very clear.
Joined Dec 2006
|
Status: Learn, share and grow!
|580 Posts
Forex market seems bullish today. Most currencies tends to go higher, even once with opposite correleation. USD/CAD is slightly bearish, expecting some bad news in NY session, but is near some good supports.
I expect some retracement which will give an opportunity to go long on most currencies.
1) I draw all R/S form 1day(TF) to 15m(TF); If useful, i also draw various trandlines to identify the trends If you can not draw trendlines, it means probably that in the TF you are using, the prices are ranging.
The top/down analysis is important to be done in the begining of the trading to determine general view of the currency you wish to trade and try to find good opportunities.
2) I draw fib lines in two ways: In the classic way i see the possible bounce(and if they coincide with S/R); In the second way I see the possible intermezzo targets ( u can see it in the chart below)
Fib. lines can be powerfull mainly when they are at the same level of a current R/S
3) i look for some bear/bearish candle-pattern in the place of possible bounce (ex: on S/R, Trendlines etc.), and i wait: that the minimum/maximum of this candle is overcome (about entry)
Candle patterns are good to watch and they may give some hint on the market direction. In your trading plan, you should define what are the patterns that you look for.
4)the exit is based on targets or on a trailing stops (on the minimum of the preceding candle)
When is it based on targets, and when on trailing stop?
I think this is a good strat for a trading plan. But you have to put much more information in your final trading plan. And much more exact details.
Try thinking as if a machine would be trading it and it need exact conditions to enter or exit the market.
The daily plan is different, like the ones posted previously with exact entries and exact exits, with eventually reasons to enter and reasons to exit. They shoud be based on a trading plan.
--------------------------- ABOUT CHART BELOW:
Circle: entry Green lines: main S/R orange lines: fib (classic way) red lines: fib (possible targets) ,( i do not know say in english how i draw them, but i take in consideration small s/r and range)
As much as this is based on your trading plan, this is valid. I personally do not rely on Oanda charts and prefer MT4 ones as they are constant, have much more utilities and can be worked on in offline mode.
ps: probably i did not take the setup in blue circle becouse was under support and the candle-pattern was not very clear. If you extend your black line, which constitute a support, conbining with the candle pattern, you may see that it was a good entry
-i'm not able to upload this link as attachment, i do not know why
I sincerely appreciate your advices and comments. Thank you haniam
About candle-patterns: i mainly look for "long shadows", but sometimes also "short day", "spinning top/bottom", "doji".
About exits: i mainly use trailing stop. I usually use targets in range. However i am still working about "exit" becouse i can not see easly targets. If you can comment about this, i appreciate it.
In the future charts i will try to be more precise