Jared: This one's for you...
Ok I was just working on something else to combine somewhat with looking at alternating days and congestions that emerge.
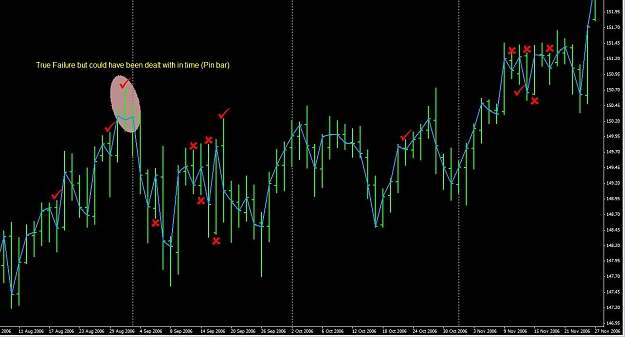
This is yet another lovely picture of E/J for those troublesome months. I haven't evaluated this outside the area shown so it's yet to be confirmed in other scenarios but what I found is during the prior uptrend leading to the circle, if there was a point where a countertrend day formed, leading to a pending pyramid long the next day if things resume within 1 more day, then I notice during the counter trend day, price did make it up in the direction of the main trend during that down day, peaking higher than the previous candle. I mark those with a check mark to show a down day with a higher high, supporting a pyramid entry the next day if the peak/valley is surpassed as usual.
When it gets to the top there is another valid signal with a down day that has a higher high during the day, but it is the end of the trend and a valid casualty of war, but we could have probably taken care of that specific reversal in time without much loss by recognizing the pin bar, or technically the "stop" valley is also right up there near the pyramid long point, there was a slight valley.
Then the X's start marking points where there were 1 day reversals where the price action on that reversal day could not make a new high or low supporting a peak or valley trade the following day. That first X occurs as a halt during a down move, but during that one up day, the bar didn't make it any lower than the day before it, so I would suggest we don't take the short trade on the next day when the valley is broken. It turns out it would have gotten stopped out.
The second X marks a 1 day counter trend to the down side where that day failed to make a higher high from the day before, so I would not take a long if the next day breaks the peak. (When I say counter trend I mean whether the most recent hump was a peak or valley, that day is going against it).
The 3rd X marks a counter day (upward) leaving behind a valley, and that counter up day didn't breach the valley it's trying to beat on the next day possibly, so I wouldn't take a pending short the next day.
This goes on for a while and by now we'd see there is a lot of that back and forth trending and a consolidation looks evident. Then there's a check mark where a one day down reversal occurs, leaving a peak behind and the bar made a new high, so if the following day should trigger a peak long trade, I'd take it, but that doesn't happen.
After this point we start seeing at least 2 consecutive days of the same trend and the consolidation range may be breaking visually. So I'd go back to normal peak and valley trading as long as there are at least 2 days of trend to work with. If there are more 1 day reversals I'd again check to see if during that reversal, a new high or low was made compared to the previous day to support a potential trade on the next day.
A little more than half way across the chart is a lone check mark, showing a one day reversal that made a higher high so I'd take the next long although it eventually gets stopped. Those other surrounding unmarked peaks and valleys would be traded as normal because they aren't 1 day reversals.
Then on the right of the chart we get another small congestion but most of them are not taken due to the X method. There is one check mark that is a failed trade but that's how it goes. Then we see more than 1 day of the same trends forming so we start trading normally and take a successful long peak that ends up in an up trend again.
I'm now going through the trending periods and making some small rules that may help protect against those bad times and at the same time not prevent getting in on good trades (like when there is a 1 day pullback and during that pullback, the bar doesn't break the previous day, I can still manage to take the next day trade instead of anticipating a consolidation if I make a few observations).
What I'm hoping to achieve is still a method that functions the same overall - just a few minutes needed at the beginning of each new daily candle in order to make the decision for the next action, just going through a small check list about what's just occurred and making a simple if-then choice. It's still a fixed set of rules that can be blindly followed without needing to use discretion unless chosen. Instead of "Oh look, a new peak, let me set a pending order" I want to take the extra minute to come up with "Oh look, a new peak, but instead of placing an order here, I'll move it up there since we had a 1 day reversal".
Ok I was just working on something else to combine somewhat with looking at alternating days and congestions that emerge.
This is yet another lovely picture of E/J for those troublesome months. I haven't evaluated this outside the area shown so it's yet to be confirmed in other scenarios but what I found is during the prior uptrend leading to the circle, if there was a point where a countertrend day formed, leading to a pending pyramid long the next day if things resume within 1 more day, then I notice during the counter trend day, price did make it up in the direction of the main trend during that down day, peaking higher than the previous candle. I mark those with a check mark to show a down day with a higher high, supporting a pyramid entry the next day if the peak/valley is surpassed as usual.
When it gets to the top there is another valid signal with a down day that has a higher high during the day, but it is the end of the trend and a valid casualty of war, but we could have probably taken care of that specific reversal in time without much loss by recognizing the pin bar, or technically the "stop" valley is also right up there near the pyramid long point, there was a slight valley.
Then the X's start marking points where there were 1 day reversals where the price action on that reversal day could not make a new high or low supporting a peak or valley trade the following day. That first X occurs as a halt during a down move, but during that one up day, the bar didn't make it any lower than the day before it, so I would suggest we don't take the short trade on the next day when the valley is broken. It turns out it would have gotten stopped out.
The second X marks a 1 day counter trend to the down side where that day failed to make a higher high from the day before, so I would not take a long if the next day breaks the peak. (When I say counter trend I mean whether the most recent hump was a peak or valley, that day is going against it).
The 3rd X marks a counter day (upward) leaving behind a valley, and that counter up day didn't breach the valley it's trying to beat on the next day possibly, so I wouldn't take a pending short the next day.
This goes on for a while and by now we'd see there is a lot of that back and forth trending and a consolidation looks evident. Then there's a check mark where a one day down reversal occurs, leaving a peak behind and the bar made a new high, so if the following day should trigger a peak long trade, I'd take it, but that doesn't happen.
After this point we start seeing at least 2 consecutive days of the same trend and the consolidation range may be breaking visually. So I'd go back to normal peak and valley trading as long as there are at least 2 days of trend to work with. If there are more 1 day reversals I'd again check to see if during that reversal, a new high or low was made compared to the previous day to support a potential trade on the next day.
A little more than half way across the chart is a lone check mark, showing a one day reversal that made a higher high so I'd take the next long although it eventually gets stopped. Those other surrounding unmarked peaks and valleys would be traded as normal because they aren't 1 day reversals.
Then on the right of the chart we get another small congestion but most of them are not taken due to the X method. There is one check mark that is a failed trade but that's how it goes. Then we see more than 1 day of the same trends forming so we start trading normally and take a successful long peak that ends up in an up trend again.
I'm now going through the trending periods and making some small rules that may help protect against those bad times and at the same time not prevent getting in on good trades (like when there is a 1 day pullback and during that pullback, the bar doesn't break the previous day, I can still manage to take the next day trade instead of anticipating a consolidation if I make a few observations).
What I'm hoping to achieve is still a method that functions the same overall - just a few minutes needed at the beginning of each new daily candle in order to make the decision for the next action, just going through a small check list about what's just occurred and making a simple if-then choice. It's still a fixed set of rules that can be blindly followed without needing to use discretion unless chosen. Instead of "Oh look, a new peak, let me set a pending order" I want to take the extra minute to come up with "Oh look, a new peak, but instead of placing an order here, I'll move it up there since we had a 1 day reversal".
Attached Image (click to enlarge)
"Support and Resistance either holds or it doesn't."
-Anonymous hillbilly