Ok---here goes possible scenarios for next wk based on COT report (01/08)-- Please use your discretion, proper MM & favorable TA to trade this report---It may take more than a wk to play out the scenarios---
Ok---here goes possible scenarios for next wk based on COT report (01/08)-- Please use your discretion, proper MM & favorable TA to trade this report---It may take more than a wk to play out the scenarios---
As per this post : http://www.forexfactory.com/showpost...&postcount=528
I use COT report in a very discretionary way---this report lags by atleast 3 days---little trick i employ--just observe the PA from tuesday till weekend & see the change if it conforms w/ COT report or not---usually views from COT report takes sometime to show up---Now what to look for:
1. Look for noncomercial positions ( I'll take 12/18/07 COT report as an example on NZD, remember, this is yr end--so this report may not reflect the true positions due to yr end position squarings)---you will see, the overall longs decreased & shorts increasing, while OI is also decreasing fitting well w/ fall of NZD till 12/18
2. Now look at commercials---these positions mainly signify hedging---but if you see extreme difference b/w long & shorts of commercial positions, you can expect some adjutments (i.e., squaring of shorts)
3. Now look at overall percentage of OI of both noncommercials & commercials & you see almost 100% short positions (now that's extreme)
4. This report strongly suggests reversal of Nzd which happened exactly---Nzd started strengthening since last 9 days or so
5. Now you wait for next COT report & so on---remember to take into account the following 3 days (after tuesday) for proper interpretation of this report
6. you can only predict future direction if you notice some extreme position like the example above---
========================================================
and my attachment I would like to know why you say AUD is bearish.
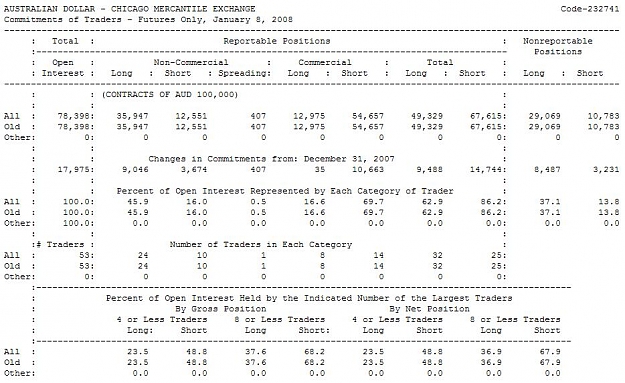
- The NON-Commercials went more long +9,046 at the same time they went more short +3,674 but more long so upmove confirmed
- The Commmercials went more short than last week by +10,663 thus confirming up move
- Open interest went up by 17,975 thus confirming the upmove in AUD last week
- Wednesday, Thusday, Friday AUD went up
The only thing that I can see that signifies AUD bearish is the Total Long / Short positions which are 49,329/67,615 and the Changes in Commitments from: December 31, 2007 which are 9,488/14,744 (more went short) and Percent of Open Interest Represented by Each Category of Trader which is at 62.9/86.2 (86.2 are short)
I realise that the COT is most useful at extremes in positioning but I would lke to know why you think AUD is bearish.
Thank you for this thread ... you are an inspiration.
Danny
Ok---here goes possible scenarios for next wk based on COT report (01/08)-- Please use your discretion, proper MM & favorable TA to trade this report---It may take more than a wk to play out the scenarios---
Thanks for your view, it tells me that you see more USD bulls against high-yielding currencies (safe haven). Can you please explain me closer, why you for example see Yen bullish ? So i can better understand how you read it.
yen numbers (non commercial + total interest):
62,001 28,857 17,563 (positions)
20,251 -15,976 -578 (change)
85.5 90.9 (total interest)
Which of these numbers tells you the bullish bias ? Or is it your gut feeling (intuition)? Because AUD has very similar numbers (more bulls than bears, more bulls added than bears, higher total short interest) and you see AUD bearish.
As per this post : http://www.forexfactory.com/showpost...&postcount=528
I use COT report in a very discretionary way---this report lags by atleast 3 days---little trick i employ--just observe the PA from tuesday till weekend & see the change if it conforms w/ COT report or not---usually views from COT report takes sometime to show up---Now what to look for:
1. Look for noncomercial positions ( I'll take 12/18/07 COT report as an example on NZD, remember, this is yr end--so this report may not reflect the true positions due to yr end position squarings)---you will see, the overall longs decreased & shorts increasing, while OI is also decreasing fitting well w/ fall of NZD till 12/18
2. Now look at commercials---these positions mainly signify hedging---but if you see extreme difference b/w long & shorts of commercial positions, you can expect some adjutments (i.e., squaring of shorts)
3. Now look at overall percentage of OI of both noncommercials & commercials & you see almost 100% short positions (now that's extreme)
4. This report strongly suggests reversal of Nzd which happened exactly---Nzd started strengthening since last 9 days or so
5. Now you wait for next COT report & so on---remember to take into account the following 3 days (after tuesday) for proper interpretation of this report
6. you can only predict future direction if you notice some extreme position like the example above---
========================================================
and my attachment I would like to know why you say AUD is bearish.
- The NON-Commercials went more long +9,046 at the same time they went more short +3,674 but more long so upmove confirmed
- The Commmercials went more short than last week by +10,663 thus confirming up move
- Open interest went up by 17,975 thus confirming the upmove in AUD last week
- Wednesday, Thusday, Friday AUD went up
The only thing that I can see that signifies AUD bearish is the Total Long / Short positions which are 49,329/67,615 and the Changes in Commitments from: December 31, 2007 which are 9,488/14,744 (more went short) and Percent of Open Interest Represented by Each Category of Trader which is at 62.9/86.2 (86.2 are short)
I realise that the COT is most useful at extremes in positioning but I would lke to know why you think AUD is bearish.
Thank you for this thread ... you are an inspiration.
Danny
Ignored
Excellent question Danny---
Remember even if it may not be full reversal, but atleast a retracement is due after a wk's sustained upmove---
Here is why:
1. COT report lags by 3 days---Aud has gone up after compilation of this report further skewing to the extreme positioning
2. Another point I have not discussed so far, but helps a lot in case of vague situations is to look at 'noreportable positions' --which are also significant in numbers---I assume them as noncommercial as a whole--so, by OI, almost 83% noncommercial longs till last tuesday not to count for the remaining 3 days' positioning--
3. Lastly prevailing market conditions & probable downside of equities next wk as a consequence of disappointing results from many US corporates incl banks (unless ofcourse, there is some forced intervention from Bernanke & co.-- which will only temporarily postpone the inevitable, i.e., increasing inflationary pressures from rising commodity prices)
Thanks for your view, it tells me that you see more USD bulls against high-yielding currencies (safe haven). Can you please explain me closer, why you for example see Yen bullish ? So i can better understand how you read it.
yen numbers (non commercial + total interest):
62,001 28,857 17,563 (positions)
20,251 -15,976 -578 (change)
85.5 90.9 (total interest)
Which of these numbers tells you the bullish bias ?
Ignored
Mades, please see my above reply---same principle applies---noncommercial longs 49% if you take nonreportable positions into account---ample scope for further yen appreciation---add to that increasing risk aversion & sustained yuan appreciation (remember yen often plays proxy for chinese yuan in forex to some extent)---
Mades, please see my above reply---same principle applies---noncommercial longs 49% if you take nonreportable positions into account---ample scope for further yen appreciation---add to that increasing risk aversion & sustained yuan appreciation (remember yen often plays proxy for chinese yuan in forex to some extent)---
GL/GT
M
Ignored
So if i understand correctly (if not, please correct me):
AUD: ~83% (non-commercial + nonreportable) + 3 days of appreciation suggests, that the number 83 will be higher and we are close to the extrema and turning point.
YEN: ~41% (non-commercial + nonreportable) + very small yen depreciation suggests, that yen bulls didn't run out of power yet and will add more long positions (changes till last tuesday + 20,251 for longs, then a small depreciation till friday).
Please, focus only on COT report, not other fundamental data you included also in answer to danny. I'm interested only what you can read from COT, so i can better understand your readings. Thank you.
Excellent question Danny---
Remember even if it may not be full reversal, but atleast a retracement is due after a wk's sustained upmove---
Here is why:
1. COT report lags by 3 days---Aud has gone up after compilation of this report further skewing to the extreme positioning
2. Another point I have not discussed so far, but helps a lot in case of vague situations is to look at 'noreportable positions' --which are also significant in numbers---I assume them as noncommercial as a whole--so, by OI, almost 83% noncommercial longs till last tuesday not to count for the remaining 3 days' positioning--
3. Lastly prevailing market conditions & probable downside of equities next wk as a consequence of disappointing results from many US corporates incl banks (unless ofcourse, there is some forced intervention from Bernanke & co.-- which will only temporarily postpone the inevitable, i.e., increasing inflationary pressures from rising commodity prices)
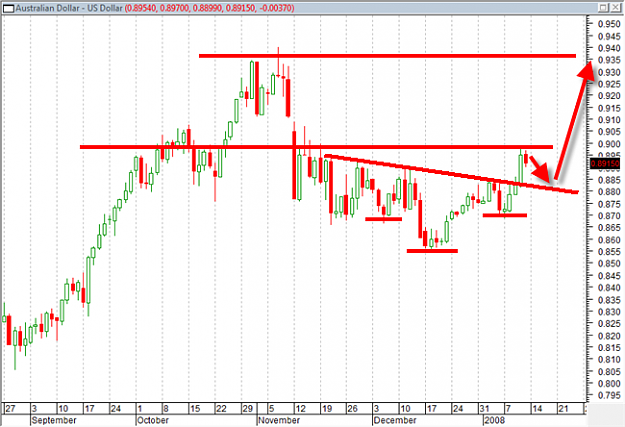
A nice retrace to the neckline in AUD/USD at .8800 and we are good to go till .9350 potentially (over 500 pips). Bernanke and the plunge protection team will not let the US economy go to the dumpster especially if with Bush's last year in office. And with the commodity prices continuing to go up (especially gold) and the AUD economy in great shape.
A potentially really sweet trade. Lets see what we get till Jan 30/31.
Did I say that I LOVE forexfactory? Really great people here!
So if i understand correctly (if not, please correct me):
AUD: ~83% (non-commercial + nonreportable) + 3 days of appreciation suggests, that the number 83 will be higher and we are close to the extrema and turning point.
YEN: ~41% (non-commercial + nonreportable) + very small yen depreciation suggests, that yen bulls didn't run out of power yet and will add more long positions (changes till last tuesday + 20,251 for longs, then a small depreciation till friday).
Please, focus only on COT report, not other fundamental data you included also in answer to danny. I'm interested only what you can read from COT, so i can better understand your readings. Thank you.
Ignored
Great questions mades. I am holding my breath for the answer :-)
I went through the other COT reports and my simple logic how MG can possible read it now tells me this:
You add the numbers and try to guess, what the number (total interest non-commercial + nonreportable) and the trend is at this moment, considering PA tuesday-friday.
If the number (long) till tuesday is close to 80 and the trend continued, you can expect turning point (AUD/NZD).
If the number (long) is around 70 or lower and you see PA tuesday-friday bullish (EUR/CHF), you can expect continuation of trend till the extrema point.
If the number (short) is around 70 or lower and you see PA tue-fri bearish (CAD/GBP) and also more added shorts positions till tuesday (so the trend tue-fri continued) and the number is far from extrema, you can expect continuation of current trend.
Now i dont consider any other fundamental data. I also tried to only fit it into MG's readings, because i have read it differently and possibly wrong.
Ignored
You are spot on Mades---besides that also see the change in Open Interest--- Sorry for adding FA to COT report here---but, I just tried to remind you all the whole picture counts in the end (i.e., TA + FA)---
|
Joined Nov 2006
|
Status: very junior member
|1,576 Posts
mg, how would you play these reports against each currency?
for eg: both aud and nzd are in extreme long positions (+80% in oi in non commercial and non reportable) in the latest report of 11 jan, and there is a pin bar on audnzd on the 9th which wld indicate a short on audnzd, and the price on 10th and 11th has dropped a bit... but how would you read this pic?
You are spot on Mades---besides that also see the change in Open Interest--- Sorry for adding FA to COT report here---but, I just tried to remind you all the whole picture counts in the end (i.e., TA + FA)---
mg, how would you play these reports against each currency?
for eg: both aud and nzd are in extreme long positions (+80% in oi in non commercial and non reportable) in the latest report of 11 jan, and there is a pin bar on audnzd on the 9th which wld indicate a short on audnzd, and the price on 10th and 11th has dropped a bit... but how would you read this pic?
Ignored
MG, I'd like to ask you if your experience has shown that some currencies are more affected than others from COT, or maybe I should ask if some have a stronger correlation? Would the "size of the market" [eg AUD obviously larger than NZD] make a difference here?
per your earlier comment, it sounds like you consider COT [as a whole?] TA rather than FA?
as an aside, "Eur: neutral bias" seems like an oxymoron... I guess you mean simply "neutral," or no bias.
Thanks for your genuine help, patience, and time you commit to this thread.
As noted earlier, you truly are an inspiration for us.
mg, how would you play these reports against each currency?
for eg: both aud and nzd are in extreme long positions (+80% in oi in non commercial and non reportable) in the latest report of 11 jan, and there is a pin bar on audnzd on the 9th which wld indicate a short on audnzd, and the price on 10th and 11th has dropped a bit... but how would you read this pic?
Ignored
I don't follow that pair closely---but, given the info in hand & this wk is big one for NZD (lots of data---will help us know how that economy is doing---lots of volatility)---still, I'll prefer to trade that pair from long side for now---
MG, I'd like to ask you if your experience has shown that some currencies are more affected than others from COT, or maybe I should ask if some have a stronger correlation? Would the "size of the market" [eg AUD obviously larger than NZD] make a difference here?
per your earlier comment, it sounds like you consider COT [as a whole?] TA rather than FA?
as an aside, "Eur: neutral bias" seems like an oxymoron... I guess you mean simply "neutral," or no bias.
Thanks for your genuine help, patience, and time you commit to this thread.
As noted earlier, you truly are an inspiration for us.
Ignored
Thanks for your encouraging words---your 'neutral bias' point noted---you're right---
Well its been almost two months since the first post; can we see an update of that account statement, just to see how well the system is still working?
Ok---here goes possible scenarios for next wk based on COT report (01/08)-- Please use your discretion, proper MM & favorable TA to trade this report---It may take more than a wk to play out the scenarios---