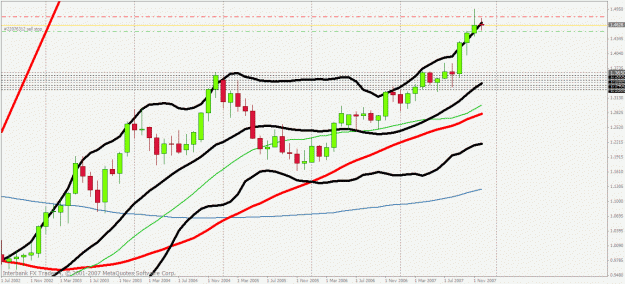
I normally don't look at bollinger bands to indicate oversold or overbought conditions, however, when I see a great indication of overextendedness on the monthly or weekly charts I'm more willing to accept its authenticity. Here's a look at the Eur/Usd on the montly chart. Notice its inability to rise above the top bollinger band of overboughtness. I think the next monthly close will be to the downside. Look what happened back in 2004 when we were extremely overbought and at the top of the bollinger band. We had a very large correction.
I won't even mention the oversoldness that is indicated in the Usd/Chf, Usd/Jpy, Usd/Cad. I think this is the bottom of the dollar.
I won't even mention the oversoldness that is indicated in the Usd/Chf, Usd/Jpy, Usd/Cad. I think this is the bottom of the dollar.
Attached Image (click to enlarge)