Time-Series EURUSD divided by USDCHF gives RATIO1(download indicator below)
Time-Series GBPUSD divided by AUDUSD gives RATIO2(download indicator below)
Time-Series RATIO1 divided by RATIO2 gives RATIO(download indicator below)
COMPARE EURUSD/USDCHF RATIO1 TO GBPUSD/AUDUSD RATIO2. PERFORMING CORRELATION ANALYSIS ON RATIO1 VS. RATIO2 GIVES NEGATIVE OR POSITIVE CORRELATION. +/- CORRELATION IS ONE OF THE REQUIREMENTS FOR HEDGING!
THE REASON FOR THIS STRATEGY: AFTER DOING PAIRS-TRADING FOR A WHILE I NOTICED THAT SOMETIMES YOU ENTER AND THE PROFIT IS NEGATIVE BETWEEN TWO INDIVIDUAL INSTRUMENTS, AND TO CANCEL OUT THAT RISK IS TO HEDGE THE HEDGE, SO THAT ONE RATIO IS NEGATIVE WHILE THE OTHER RATIO IS POSITIVE.
EXAMPLE, NORMALLY YOU WOULD HEDGE EURUSD WITH GBPUSD, BUY EURUSD AND SELL GBPUSD! OR VICE VERSA, DEPENDING ON RATIO.
NOW SUPPOSE THE HEDGE GOES AGAINST YOU, AND YOU ARE NEGATIVE ON YOUR PROFIT......... HERE IS WHERE THE OTHER HEDGE WILL BE POSITIVE.
SO TO HEDGE THE HEDGE, I NOTICED THAT RATIO1 VS. RATIO2 HAS NEGATIVE/POSITIVE CORRELATION, WHICH MEANS WHEN THE RATIO OF RATIO1/RATIO2 IS 2 STANDARD DEVIATIONS AWAY FROM MEAN, YOU WOULD:
[SELL RATIO1 AND SELL RATIO2] (negative correlation, ratio touching upper bollinger band, overbought)
-or-
[BUY RATIO1 AND BUY RATIO2] (negative correlation,ratio is touching lowest bollinger band, oversold)
-or-
[BUY RATIO1 AND SELL RATIO2] (positive correlation, ratio is touching lowest bollinger band, oversold)
-or-
[SELL RATIO1 AND BUY RATIO2] (positive correlation, ratio is touching upper bolling band, overbought)
SO FOR EXAMPLE IF RATIO OF RATIO1/RATIO2 IS OVERBOUGHT ON NEGATIVE CORRELATION, YOU WOULD SELL RATIO1 AND SELL RATIO2 WHICH EQUALS, SELL EURUSD, SELL USDCHF, SELL GBPUSD, BUY AUDUSD. NO STOPLOSS IS SET, SINCE TWO INSTRUMENTS WILL BE POSITIVE AND TWO WILL BE NEGATIVE. ALSO, BEFORE ENTRY, ANALYZE CORRELATION BETWEEN:
EURUSD VS. USDCHF
EURUSD VS. AUDUSD
GBPUSD VS. AUDUSD
USDCHF VS. GBPUSD
AUDUSD VS. USDCHF
EURUSD VS. GBPUSD
NOTE: CORRELATION ANALYSIS FOR EACH ABOVE SHOULD BE DONE ON 15M,30M,1H,4H,1D FOR 30,90,180 PERIODS
EXIT WHEN RATIO RETURNS BACK TO THE MEAN
i HAVE BEEN TESTING THIS AND WHEN YOU HEDGE IN GENERAL, THE RETURNS ARE DECREASED, AND WITH THIS HEDGE THE HEDGE CONCEPT THE RETURNS ARE EVEN SMALLER, BUT YOU ARE PROTECTED AGAINST NEGATIVE PROFIT ON THE SIMPLE HEDGE WHERE YOU ONLY SELL EURUSD AND BUY GBPUSD. BECAUSE WITH THIS: WHEN RATIO1 IS NEGATIVE, THE OTHER RATIO2 IS POSITIVE.....................................BECAUSE OF NEGATIVE CORRELATION BETWEEN RATIO1 AND RATIO2... OF-COURSE, IF ALL CORRELATIONS START BREAKING DOWN, AND ALL OF THE PAIRS START SWINGING LIKE CRAZY, THEN YEAH THAT IS THE RISK, BUT I'M ASSUMING THAT CORRELATION IS HIGH ON DIFFERENT TIME FRAMES.....
Note: when you enter with these 4 pairs, eurusd, usdchf, gbpusd, audusd, notice that there is correlation between all pairs. I.E. eurusd can be hedged with usdchf, eurusd can be hedged with gbpusd, eurusd can be hedged with audusd, gbpusd can be hedged with usdchf, and audusd can be hedged with usdchf. So overall, depending on correlation between ratio1 and ratio2, you can setup to be hedged across 4 pairs.
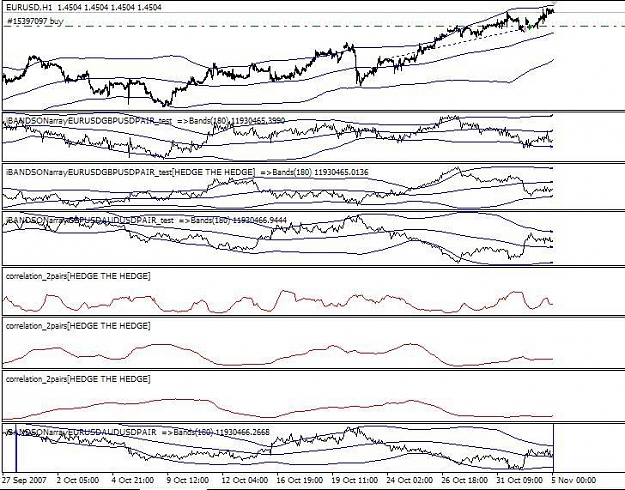
Below are the indicators for this strategy:
1. correlation indicator for ratio1 vs ratio2
2. ratio1 indicator for eurusd/usdchf
3. ratio2 indicator for gbpusd/audusd
4. ratio indicator for ratio1/ratio2. ([eurusd/usdchf] / [gbpusd/audusd])
5. template for the indicator setup,
Correlation indicators has a bug: setup three different indicators for correlation, one for 30 periods, 90 periods, 180 periods, so that different correlation time frames show up!
1.when you load the correlation indicator for ratio1 vs. ratio 2, the correlation values will not show up right away, you have to switch to another chart, and wait for a tick to update the data arrays, only then the correlation will be displayed for ratio1 vs. ratio2. Basically switch to another chart, and then come back after the data updates, and the correlation information will show up.
Ratio1 indicator:
Type pair1, type pair2 2. This doesn't have a bug, but to apply bollinger bands to this ratio, you have to find the bollinger band indicator on the left window of METATRADER, then drag the BB indicator over the ratio window, and when the options comes up, select your appropriate values for period and for BB bands to show up you have to "apply to: first indicator data". Only this way the bands will show up.
Ratio2 Indicator
Type pair1, type pair2
3. you have to apply the same BB band process as in previous process.
Hedge the Hedge Indicator
Type in pair1, pair2, pair3, pair4 4. To apply bollinger bands on this indicators, apply the steps from above, find BB indicator, drag it over the ratio, select: first indicator data in apply to window.
PLEASE POST FEEDBACK ON WHAT YOU THINK AND WHAT IS THE BEST RULES FOR USING THIS SYSTEM.
Time-Series GBPUSD divided by AUDUSD gives RATIO2(download indicator below)
Time-Series RATIO1 divided by RATIO2 gives RATIO(download indicator below)
COMPARE EURUSD/USDCHF RATIO1 TO GBPUSD/AUDUSD RATIO2. PERFORMING CORRELATION ANALYSIS ON RATIO1 VS. RATIO2 GIVES NEGATIVE OR POSITIVE CORRELATION. +/- CORRELATION IS ONE OF THE REQUIREMENTS FOR HEDGING!
THE REASON FOR THIS STRATEGY: AFTER DOING PAIRS-TRADING FOR A WHILE I NOTICED THAT SOMETIMES YOU ENTER AND THE PROFIT IS NEGATIVE BETWEEN TWO INDIVIDUAL INSTRUMENTS, AND TO CANCEL OUT THAT RISK IS TO HEDGE THE HEDGE, SO THAT ONE RATIO IS NEGATIVE WHILE THE OTHER RATIO IS POSITIVE.
EXAMPLE, NORMALLY YOU WOULD HEDGE EURUSD WITH GBPUSD, BUY EURUSD AND SELL GBPUSD! OR VICE VERSA, DEPENDING ON RATIO.
NOW SUPPOSE THE HEDGE GOES AGAINST YOU, AND YOU ARE NEGATIVE ON YOUR PROFIT......... HERE IS WHERE THE OTHER HEDGE WILL BE POSITIVE.
SO TO HEDGE THE HEDGE, I NOTICED THAT RATIO1 VS. RATIO2 HAS NEGATIVE/POSITIVE CORRELATION, WHICH MEANS WHEN THE RATIO OF RATIO1/RATIO2 IS 2 STANDARD DEVIATIONS AWAY FROM MEAN, YOU WOULD:
[SELL RATIO1 AND SELL RATIO2] (negative correlation, ratio touching upper bollinger band, overbought)
-or-
[BUY RATIO1 AND BUY RATIO2] (negative correlation,ratio is touching lowest bollinger band, oversold)
-or-
[BUY RATIO1 AND SELL RATIO2] (positive correlation, ratio is touching lowest bollinger band, oversold)
-or-
[SELL RATIO1 AND BUY RATIO2] (positive correlation, ratio is touching upper bolling band, overbought)
SO FOR EXAMPLE IF RATIO OF RATIO1/RATIO2 IS OVERBOUGHT ON NEGATIVE CORRELATION, YOU WOULD SELL RATIO1 AND SELL RATIO2 WHICH EQUALS, SELL EURUSD, SELL USDCHF, SELL GBPUSD, BUY AUDUSD. NO STOPLOSS IS SET, SINCE TWO INSTRUMENTS WILL BE POSITIVE AND TWO WILL BE NEGATIVE. ALSO, BEFORE ENTRY, ANALYZE CORRELATION BETWEEN:
EURUSD VS. USDCHF
EURUSD VS. AUDUSD
GBPUSD VS. AUDUSD
USDCHF VS. GBPUSD
AUDUSD VS. USDCHF
EURUSD VS. GBPUSD
NOTE: CORRELATION ANALYSIS FOR EACH ABOVE SHOULD BE DONE ON 15M,30M,1H,4H,1D FOR 30,90,180 PERIODS
EXIT WHEN RATIO RETURNS BACK TO THE MEAN
i HAVE BEEN TESTING THIS AND WHEN YOU HEDGE IN GENERAL, THE RETURNS ARE DECREASED, AND WITH THIS HEDGE THE HEDGE CONCEPT THE RETURNS ARE EVEN SMALLER, BUT YOU ARE PROTECTED AGAINST NEGATIVE PROFIT ON THE SIMPLE HEDGE WHERE YOU ONLY SELL EURUSD AND BUY GBPUSD. BECAUSE WITH THIS: WHEN RATIO1 IS NEGATIVE, THE OTHER RATIO2 IS POSITIVE.....................................BECAUSE OF NEGATIVE CORRELATION BETWEEN RATIO1 AND RATIO2... OF-COURSE, IF ALL CORRELATIONS START BREAKING DOWN, AND ALL OF THE PAIRS START SWINGING LIKE CRAZY, THEN YEAH THAT IS THE RISK, BUT I'M ASSUMING THAT CORRELATION IS HIGH ON DIFFERENT TIME FRAMES.....
Note: when you enter with these 4 pairs, eurusd, usdchf, gbpusd, audusd, notice that there is correlation between all pairs. I.E. eurusd can be hedged with usdchf, eurusd can be hedged with gbpusd, eurusd can be hedged with audusd, gbpusd can be hedged with usdchf, and audusd can be hedged with usdchf. So overall, depending on correlation between ratio1 and ratio2, you can setup to be hedged across 4 pairs.
Below are the indicators for this strategy:
1. correlation indicator for ratio1 vs ratio2
2. ratio1 indicator for eurusd/usdchf
3. ratio2 indicator for gbpusd/audusd
4. ratio indicator for ratio1/ratio2. ([eurusd/usdchf] / [gbpusd/audusd])
5. template for the indicator setup,
Correlation indicators has a bug: setup three different indicators for correlation, one for 30 periods, 90 periods, 180 periods, so that different correlation time frames show up!
1.when you load the correlation indicator for ratio1 vs. ratio 2, the correlation values will not show up right away, you have to switch to another chart, and wait for a tick to update the data arrays, only then the correlation will be displayed for ratio1 vs. ratio2. Basically switch to another chart, and then come back after the data updates, and the correlation information will show up.
Ratio1 indicator:
Type pair1, type pair2 2. This doesn't have a bug, but to apply bollinger bands to this ratio, you have to find the bollinger band indicator on the left window of METATRADER, then drag the BB indicator over the ratio window, and when the options comes up, select your appropriate values for period and for BB bands to show up you have to "apply to: first indicator data". Only this way the bands will show up.
Ratio2 Indicator
Type pair1, type pair2
3. you have to apply the same BB band process as in previous process.
Hedge the Hedge Indicator
Type in pair1, pair2, pair3, pair4 4. To apply bollinger bands on this indicators, apply the steps from above, find BB indicator, drag it over the ratio, select: first indicator data in apply to window.
PLEASE POST FEEDBACK ON WHAT YOU THINK AND WHAT IS THE BEST RULES FOR USING THIS SYSTEM.
Attached File(s)