PipChick, you got a great handle on this market! I bought that bounce at 25, and wow, the dow futures jumped, I wonder why. But it is playin in our favor. If we can get thru all this resistance at 235.15 twill be nice.
PipChick & Karmo- First thanks for your ongoing chart analysis. It really helps us newbee's learn.
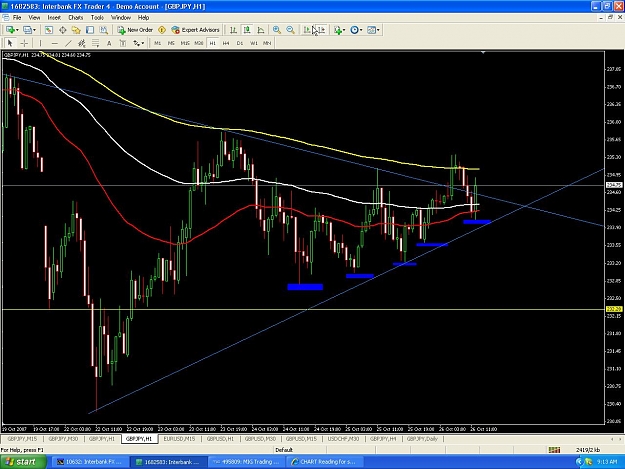
I've noticed something on the 30 min chart that I'd like you to interpret and see if I'm on the right track.
It looks like we have a perfect head and shoulders, with the shoulders being at about where we are now, 234.5x area and the head at about the 235 area.
Also the price seems to be hovering at around the 50fib of the last upward move.
I know you said that 61.8 might be a good buy point and Karmo has said in the past that we always get a 50% re-trace.
So I guess my question here is, what do we look for as a sign that this is either going higher or lower? If it breaks either the 61.8 or 38.2 fibs?
Also, could you explain the significance of the "head and shoulders"? I know you mentioned that there's is one forming on the 1hr chart also.
I know this may be alot to ask, but we seem to be in a holding pattern right now, so I'll take this opportunity to learn something.
Thanks
Ignored
RVD...the next 15 min will tell us if the 30 is forming a down h/s.
OK, Thanks. But how do you know that this latest move up will continue or is is just a retrace of the lastest move down?
Thanks
Ignored
Well we can never predict what it will do so we can only read the charts and make a probably plan from them. But if you look at the 1 hr chart we keep making higher lows over the last three days and I believe it wants to continue up. We have news at 10 am est so we protect our profits because news can distort or plans temporairly and in some cases (depending on the data) longer term.
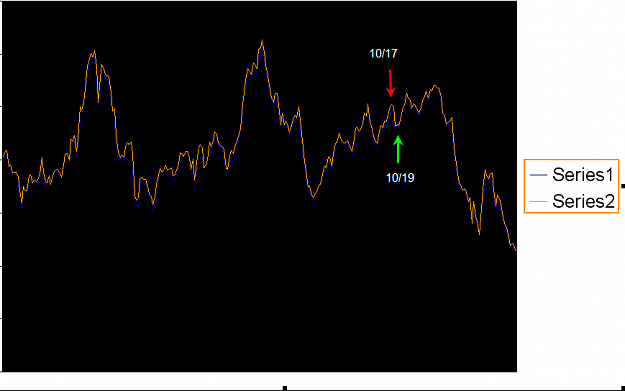
Oh really? Maybe I miss understand "predicting" a market. Each year, I predict where the markets I trade will be over the course of a year. In my way of thinking, prediction does not have to be 100%, 90% is just fine with me. Time-price trading is based on just this: predicting at what time a currency will be at what price whether by using cycles, fibonacci, angle projections, or chicken bones.
Attached is my yearly gbp/jpy prediction. It was completed in December of last year. So far, it has captured the movement of this currency. Most can not make such a prediction, but there are those that can with reasonable accuracy.
Nice work Actio, impressive, something to look forward to, looks like a lot of work went into this, what starting point do you use for those projections if you don't mind me asking? Btw, I'm assuming that you had programed the algorithm into some kind of a program, or do you prefer to do it manually?