I have attached 2 charts (5 min) from todays EURJPY trades that I took (on my demo account) using this system. I have noticed that some of the best trades with this system set up when the 85 and 55 Laguerre's are at the extreme and then the 55 moves out and crosses the center line, thus generating a trading signal in the direction of the 55. Note on the 2nd trade on my chart how the 85 had only just made it to the extreme at the bottom when the 55 took off long.
When the 85 is pinned against the extreme in a protracted trend up or down, you will find that sometimes this trade (above) fails and the 55 turns back toward the 85. If the 55 makes it past the center line and then crosses back over toward the 85, trade in the direction of the 55.
By the way the high and low boundaries on my charts are 9-period Donchian channels. I really like the way that they define the trend (or lack of trend) and I also use them as S/L levels.
I have attached a chart from todays EURJPY trade showing the other trade I referred to above, which I call a "slingshot" - a name which I did not make up, but which aptly describes trading with 2 indicators, where the long indicator stays pinned against the extreme (85 in this case) while the short indicator (55) takes a trip to the other side (but fails) and then returns to extreme where the long indicator remains. This was a wonderful "scalp" which should have netted at least 30 pips...which is in addition to the other trades that I set forth above, all of which set up today.
By the way, I am not trying to hijack this thread IMRAN, only trying to set forth some of my observations of your system. I really like it and am going to continue to work with it. Just thought I would share this with everyone.
Ignored
Great observations I think. Thanks for the heads up.
I have attached a chart from todays EURJPY trade showing the other trade I referred to above, which I call a "slingshot" - a name which I did not make up, but which aptly describes trading with 2 indicators, where the long indicator stays pinned against the extreme (85 in this case) while the short indicator (55) takes a trip to the other side (but fails) and then returns to extreme where the long indicator remains. This was a wonderful "scalp" which should have netted at least 30 pips...which is in addition to the other trades that I set forth above, all of which set up today.
By the way, I am not trying to hijack this thread IMRAN, only trying to set forth some of my observations of your system. I really like it and am going to continue to work with it. Just thought I would share this with everyone.
Ignored
I've noticed this as well. I'd like to hear what Imran has to say about it.
I have attached 2 charts (5 min) from todays EURJPY trades that I took (on my demo account) using this system. I have noticed that some of the best trades with this system set up when the 85 and 55 Laguerre's are at the extreme and then the 55 moves out and crosses the center line, thus generating a trading signal in the direction of the 55. Note on the 2nd trade on my chart how the 85 had only just made it to the extreme at the bottom when the 55 took off long.
When the 85 is pinned against the extreme in a protracted trend up or down, you will find that sometimes this trade (above) fails and the 55 turns back toward the 85. If the 55 makes it past the center line and then crosses back over toward the 85, trade in the direction of the 55.
By the way the high and low boundaries on my charts are 9-period Donchian channels. I really like the way that they define the trend (or lack of trend) and I also use them as S/L levels.
Ignored
Hi
Excellent work, i welcome you to this thread and plesae feel free to post your charts and comments on this method, so all of us, including me can learn from it, we all are always learning
the Donchian channels look really good..can u post that indicator or does it come standard in mt4 ?
I have attached a chart from todays EURJPY trade showing the other trade I referred to above, which I call a "slingshot" - a name which I did not make up, but which aptly describes trading with 2 indicators, where the long indicator stays pinned against the extreme (85 in this case) while the short indicator (55) takes a trip to the other side (but fails) and then returns to extreme where the long indicator remains. This was a wonderful "scalp" which should have netted at least 30 pips...which is in addition to the other trades that I set forth above, all of which set up today.
By the way, I am not trying to hijack this thread IMRAN, only trying to set forth some of my observations of your system. I really like it and am going to continue to work with it. Just thought I would share this with everyone.
Ignored
The way the Lags work are that the Blue is our trigger for entry and since its gamma setting is set to low, sometimes its creates false signals, so to make sure of our entry, i had introduced the 2nd Lag ( Red) to atleast cofirm where the trend is so we can follow that
I am happy that you are contributing and i request everyone who is successfully using this to share so it benefits all
I was wondering what you thought of these two scalps. Were they too risky? Were they OK because the indicators were right? The result was positive, but I'd still like you input.
I put a yellow up arrow where I entered and a yellow check mark where I exited. I also put entry and exit prices.
The first trade had lag 1 pointing up above 0.15 with lag 2 flat on bottom. It also happened after two HUGE candles in the other direction. I knew that that kind of move in a single 1 min period couldn't continue and would have to be corrected. I also saw that it was very close to support. I immediately bought (about 30 seconds late) @ 236.79. 1 min later I dumped it at 236.91 for 12 pips. Not bad for a 1 minute scalp (quite literally).
The second trade I saw lag 1 pointing up above 0.15 with lag 2 flat on bottom again. For whatever reason, I hesitated, and waited for more confirmation which took about 4 mins and gave up a potential 10+ additional pips. Once Lag 1 continued to rise I bought @ 236.91, then dumped it @ 236.99 for 8 pips. I dumped it too early as you can see on the graph, there were another 13 pips afterwards. The reason I dumped it at .99 was because I always treat psychological barriers (00's) as support and resistance as prices usually don't like to break through the 00's. This time that was not the case I guess.
I'm getting a better feel for the "pulse" of the GBP/JPY, but I'm still working on my timing. For example, my 2nd trade could have been 30 pips and I only got 8 of them. Still, not bad for a 4 minute trade.
Also, I've been using lag 1 for exit, not lag 2. I find that for the 1 min chart lag 2 is too slow and I'll hit my S/L if I wait for lag 2. Do you think this is OK?
Ignored
Pips in the bank are more important, i consider 1 pip profit also as profit, imagine if u were trading 100 standard lots think that way..think Big.
I have marked on the charts where u should have ideally entered and pls you need to trust the Red Lag, do not exit a trade when the red Lag is rising, use this to exit the trade, not the Blue Lag, potentially this trade should have got u atleast 40+ pips, i took this trade too and exited at 237.05
Lag 2 works good on anytime frame , so 1 min is no exception
if ur entry was at 236.75 and SL of 236.60, u can see that no way ur SL would have been hit
Here's an example of what I'm talking about with the EMA.
Look at this chart. The EMA crosses, there's a HUGE upward candle during the same 1 minute period.
You see the EMA crossed, your indicator makes it's sound, so you buy. It never moves a single pip in the right direction and you hit your stop loss 5 mins later.
Now, it did move in an upward over-all TREND after that cross, but you'd need a 40+ pip S/L to even stay in it.
Now, again, you would never trade just based off EMA, because if you look at the lags this is NOT a good entry point. However, I just wanted to show how the EMA can screw you if you're not careful.
EMA can be a very powerful tool in predicting a big move, but don't forget the basics.
Ignored
Bfried,
EMA crossing is indeed a very powerful tool. But you have to take VERY FAST EMA's. As stated on this forum, i use always a ema9, ema20 and ma31
I just installed the alert indicator ( it has the same name as my nickname http://www.forexfactory.com/images/icons/icon12.gif
this is a really silly question and my aplogises in advance for asking it .
i have downloaded the metatrader 4 platform from northfinance, however how do i get the custom indicators onto it, i assume the file is on the posting but i cant figure how to get it onto the platform.
is there somewherre step by step written which shows this
EMA crossing is indeed a very powerful tool. But you have to take VERY FAST EMA's. As stated on this forum, i use always a ema9, ema20 and ma31
I just installed the alert indicator ( it has the same name as my nickname http://www.forexfactory.com/images/icons/icon12.gif
Ignored
oeps, too fast transmitted.....
anyway it is working, the alert that wil sound the bar after the cross because i presume that the alert only trigger ( sound) at the close of the "crossin" bar and so the value indicates for the alert
Of course, in a choppy market you will have more alerts ( sometimes to mutch) On the sound you have to verify if laguerre strategiy is in application
So an alert for the crossing ma's 60 and 200 is out of the question (for me) but it can be used to see the trend, not for trading on 5 min chart i think
I hope to give with this more insiht in crossings of 2 value's in this case ma's , ema ........
this is a really silly question and my aplogises in advance for asking it .
i have downloaded the metatrader 4 platform from northfinance, however how do i get the custom indicators onto it, i assume the file is on the posting but i cant figure how to get it onto the platform.
is there somewherre step by step written which shows this
once again apolgises for the daft post
kashif
Ignored
1. Download the lag indicator from post #1
2. Close MT4.0
3. Go to the MT folder, go to experts, go to customer indicators.
4. Copy and paste the mq4 file into the customer indicators folder.
5. Restart MT4.0 and seek for your indicator in the customer indicator column. Double click it and it should be implemented into your graph.
Pips in the bank are more important, i consider 1 pip profit also as profit, imagine if u were trading 100 standard lots think that way..think Big.
I have marked on the charts where u should have ideally entered and pls you need to trust the Red Lag, do not exit a trade when the red Lag is rising, use this to exit the trade, not the Blue Lag, potentially this trade should have got u atleast 40+ pips, i took this trade too and exited at 237.05
Lag 2 works good on anytime frame , so 1 min is no exception
if ur entry was at 236.75 and SL of 236.60, u can see that no way ur SL would have been hit
Ignored
Thanks Imran,
I wasn't at my computer yet so that first trade you showed wasn't possible. I wish I had been there . Do you think getting the 11 pips on the rebound of that huge movement was a good idea, or risky?
As for the second trade, I was going to enter where you circled but, like I said, I hesitated and got in late...no idea why . Anyway, if I had followed the red lag it would have hit my trailing stop. Are you suggesting that I don't use a trail and just a regular S/L?
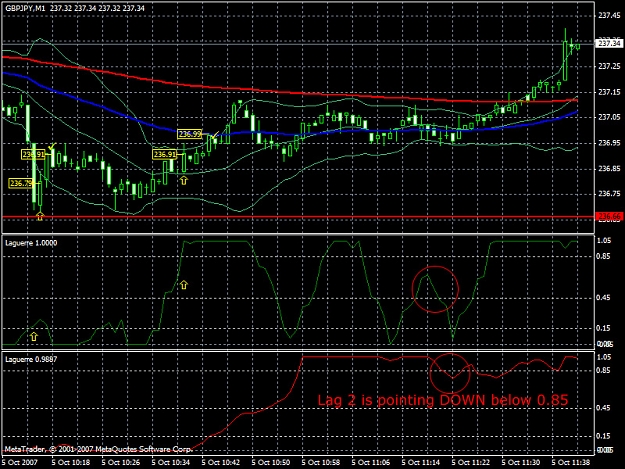
If so, take look at this chart. The red lag has a false exit indicated. I've circled it. If I had stayed in that trade, I would have seen lag 2 point down below 0.85 and exited, for MAYBE 5 pips more than I had gotten over 20 mins before (when I exited at 236.99). It wasn't until after this false exit signal that there was a huge move up to 237.34, where I could have made 30+ pips.
Also, once the red lag pins against the top don't you want to take profit on half of your position? Or is that no longer the case. I believe you said that before.
1. Download the lag indicator from post #1
2. Close MT4.0
3. Go to the MT folder, go to experts, go to customer indicators.
4. Copy and paste the mq4 file into the customer indicators folder.
5. Restart MT4.0 and seek for your indicator in the customer indicator column. Double click it and it should be implemented into your graph.
I wasn't at my computer yet so that first trade you showed wasn't possible. I wish I had been there . Do you think getting the 11 pips on the rebound of that huge movement was a good idea, or risky?
As for the second trade, if I had followed the red lag it would have hitmy trailing stop. Are you suggesting that I don't use a trail and just a regular S/L?
If so, take look at this chart. The red lag has a false exit indicated. I've circled it. If I had stayed in that trade, I would have seen lag 2 point down below 0.85 and exited, for MAYBE 5 pips more than I had gotten over 20 mins before (when I exited at 236.99). It wasn't until after this false exit signal that there was a huge move up to 237.34, where I could have made 30+ pips.
Also, once the red lag pins against the top don't you want to take profit on half of your position? Or is that no longer the case. I believe you said that before.[/quote]
Hello BFriend,
I saw your charts and you use MT4. Is trailing stop an option you get from your broker ? I am asking you because I use MT4 too but only have regular stop loss option (I can manually trail stop my transactions).