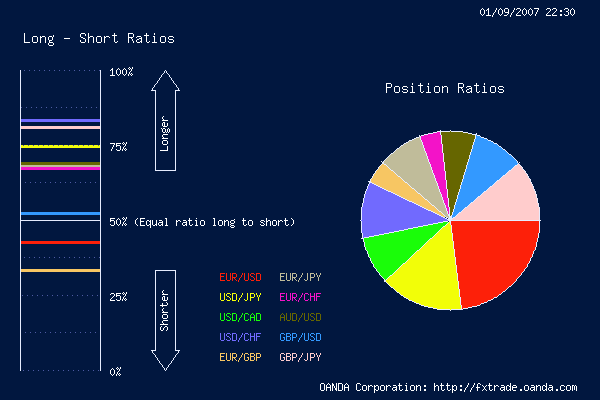
Oanda has a "FX open positions" chart. I am going to open a demo account with $1,000 in it and open long or short positions based on where the ratio's currently are. If the ratio doesn't show much bias, ie 12.5% on either side of 50 then I won't open a position. I'll also close any open order if the pair slips into this zone.
There are 10 pairs and I'll be opening positions in 8 of them. I'll put a 100 pip stop loss on them all for one percent. So at worst I could lose 10 percent at one time if I had all of the currencies had open positions. I will then move the stops up as my normal trading stragey indicates.
I'll check the trade once every 24 hours and see how things go!
EUR/USD: too close to 50%
USD/JPY: long
USD/CAD: long, though this chart isn't too clear on that.
USD/CHF: long
EUR/GBP: short
EUR/JPY: long
EUR/CHF: long
AUD/USD: long
GBP/USD: too close to 50%
GBP/JPY: long
I'll open positions Monday morning my time (around 2200 GMT Sunday) and post the opening balances.
There are 10 pairs and I'll be opening positions in 8 of them. I'll put a 100 pip stop loss on them all for one percent. So at worst I could lose 10 percent at one time if I had all of the currencies had open positions. I will then move the stops up as my normal trading stragey indicates.
I'll check the trade once every 24 hours and see how things go!
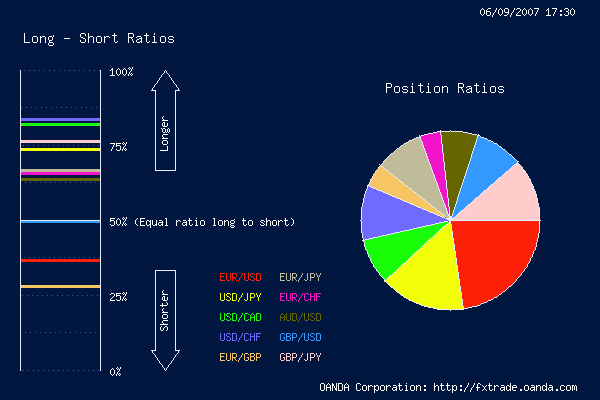
EUR/USD: too close to 50%
USD/JPY: long
USD/CAD: long, though this chart isn't too clear on that.
USD/CHF: long
EUR/GBP: short
EUR/JPY: long
EUR/CHF: long
AUD/USD: long
GBP/USD: too close to 50%
GBP/JPY: long
I'll open positions Monday morning my time (around 2200 GMT Sunday) and post the opening balances.
Attached Image