Just to clarify further, on Monday, we have only one Fibo (used as daily and weekly).
On Tue to Fri, we have weekly Fibo (Monday static) for weekly fib and daily fibo drawn on daily 0000 GMT every new day.
We forget about last week Monday Fibo. Is that right for above ?
Ignored
Yes, correctly pointed. Should anyone want to keep all the previous Fibo, it will be permitted under 1 condition, that is please dont Jessica me, I mean; dont sue me when you start to see everything double. Hi Honey, let me hug you............ Where are you going? Im right here..!!!!
|
Joined Aug 2006
|
Status: Believe and Achieve Proverbs 16:3
|731 Posts
I have been following the thread, but I must have missed something. Why are there 2 sets of fibos set-up by aha's EA and how are they to be used. There is so much in this thread that I am havign trouble keeping up I guess. I have been on teamspeak also hoping it was going to be covered but it wasnt.
I appreciate everyone's patience for this probably duplicate question. Thanks in advance for any help folks!
Joined May 2006
|
Status: Only one user name...
|1,367 Posts
Quoting aha
Disliked
This version added daily fibo and weekly fibo (color adjustable)
Ignored
The color of the fibos can indeed be changed by selecting the object and using edit but it immediately reverts to the hard-coded color when the indicator is redrawn.
I suspect that the indicator is still not smart enough to show the trend right at trend reversal or ranging market. Has anyone tested it using the "daysago" parameter on different market situations?
The weekly fibo starts from the beginning of Monday now: thanks for spotting that, Orange.
There are two parameters in the indicator 's properties to select color for the two fibos.... yeah, I guess that's like adding feet to a snake..... you could have changed it directly from the chart.
Quoting Lou G
Disliked
The color of the fibos can indeed be changed by selecting the object and using edit but it immediately reverts to the hard-coded color when the indicator is redrawn.
The trend detector of this indicator may not be very reliable during the trend reversal period (I guess that's even tough for an experienced trader). But I will implement the bull sell signals anyway, and improve the trend detector later.
A question though (For Orange):
Which bar will be the best bar to put an arrow on? The first bar close/open in a Q zone?
May the force be with you.
Quoting OrangeRoshan
Disliked
Another Indicator:
Purpose:
To Show a Buy and Sell Signal on the Quadrants.
Buy: Green Arrow Up
Sell: Red Arrow Down
Monday Trade: Blue Arrow showing the Direction of the Trade
Q1 - Top
Q2 - Top Middle (near Median)
Q3 - Bottom Middle (near Median)
Q4 - Bottom
Bullish Trend:
Q1: Sell
Q2: Buy or wait until it enters Q3 then Buy (Arrow + Q#)
Q3: Buy
Q4: Buy
Bearish Trend:
Q1: Sell
Q2: Sell
Q3: Sell or wait until it enters Q2 then Sell (Arrow + Q#)
Q4: Buy
This Indicator will help learning faster for many Traders in the SRDC Thread. It will also be intergrated later inside the EA. We can check the EA accuracy on Entry as we follow the Trade everyday.
Today's average range for cable is 184 pips, we have only moved 70 pips. So I would expect a huge move for USD ISM Non-Manufacturing Index (in about 40 min).
Joined May 2006
|
Status: Only one user name...
|1,367 Posts
Quoting aha
Disliked
There are two parameters in the indicator 's properties to select color for the two fibos.... yeah, I guess that's like adding feet to a snake..... you could have changed it directly from the chart.
Ignored
Thanks aha - I have it now. Just a reminder for the next revision - weekly fibo needs to start on Monday. Also, could you include the revision number in the indicator name so we can tell which version we have on the chart (by using right click/indicators)? That would be great...
Orange, i've read every post from a to z and have followed the thread each day and am enjoying the study. I have a Q pertaining to the fibos that are currently drawn on the LRC. What thought/reasoning is behind drawing the fibos from the extremes of the channel on a given day rather than drawing the fibos in the traditional sense from "A" to "B" on actual price? What exactly are we trying to indicate by such unconventional drawing of the fibos?
[quote=aha]The trend detector of this indicator may not be very reliable during the trend reversal period (I guess that's even tough for an experienced trader). But I will implement the bull sell signals anyway, and improve the trend detector later.
Really not very reliable. Having lost some money make me think. (one might think that I don't think when I am happy...)
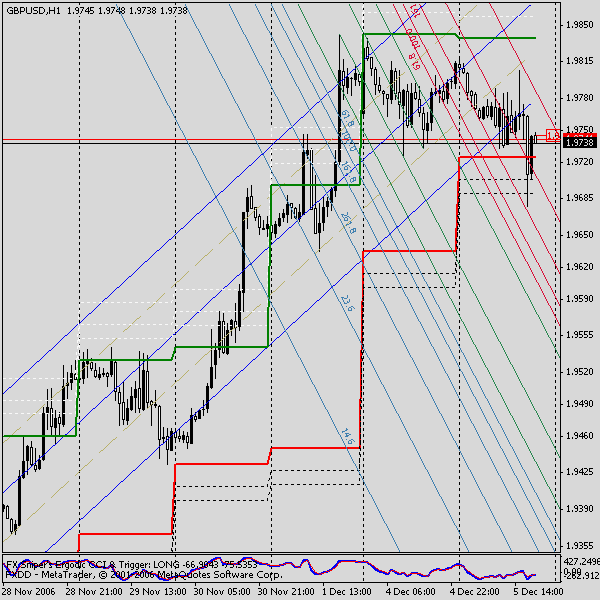
Maybe you wanna look at this. These are regular Fibo Channels I only attached two more levels to them. The chart is a mess, but you can see - they were more accurate. Our beloved "jedy" indicator is a little bit too late.
The trend detector of this indicator may not be very reliable during the trend reversal period (I guess that's even tough for an experienced trader). But I will implement the bull sell signals anyway, and improve the trend detector later.
A question though (For Orange):
Which bar will be the best bar to put an arrow on? The first bar close/open in a Q zone?
May the force be with you.
Ignored
Entry at 00:00GMT for IBFX, but some broker start late. So its the opening price of the first candle of the day.
Orange, i've read every post from a to z and have followed the thread each day and am enjoying the study. I have a Q pertaining to the fibos that are currently drawn on the LRC. What thought/reasoning is behind drawing the fibos from the extremes of the channel on a given day rather than drawing the fibos in the traditional sense from "A" to "B" on actual price? What exactly are we trying to indicate by such unconventional drawing of the fibos?
THX in advance,
Thom
Ignored
Good Question Thom. Going back to my history, I am actually self-taught in forex. Only after some years, I stumbled upon many pros, who are more experience than me.
On one boot camp of Pro traders, While we were doing a live trade, I drew my fibo the way as i taught here. Quite a number raise their eyebrows and start looking at my screen. I simply said to them, I have been doing this for many years, and it help me in catching dips & bounce. They agree!
My point is, my most evident trading skill is always been in using Support & Resistance using a channel. And I found out, drawing fibo between the H&L of channel (trend) suit my trading style, with very positive results of course.
Then on, I realised that, there are not 1 single way of drawing Fibo lines. The moto is, as long as it pips consistently, thats fine, and Im yet still to learn many other ways... whenever possible.
One trick I found out is, to adjust the FIBO placement, between the previous charts (1-2 days) and see, which way of drawing it that catches the recent move more efficiently. Then when you found it, use it.
I think the explaination is, There are many types of Big boys out there. They trades differently with different sentiment and I think some fibo showed another group's sentiment and other fibo showed the other.