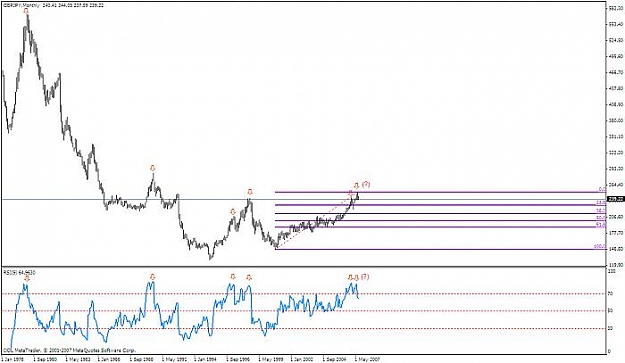
This is at least the third time I've posted this chart in the last few weeks. Please take note of the correlation between the peaking of RSI over the 70 line and the subsequent falls which took place. (By the way, I'm not here to argue whether or not 70 delineates overboughtness on the RSI. Frankly I don't care if it's considered overbought or not. The point is that once it peaks over 70 a major fall usually occurs). I have also laid down some fibs on this chart which I hadn't done before. A retracement to the 23.6 Fib alone would take it to around 227. The 38.2 Fib would be around 212. The 50 Fib would take it all the way down to 200. Seems impossible, I know, especially with the carry trades, but this beast was trading under 200 less than 2 years ago when I first started live trading the forex. A 50% retracement impossible? The last major retracement from the 1995 to 1998 run up actually surpassed the 61.8 Fib. It took 3 years for it to run up 11,000 pips and only 2 years to run down past the 61.8 level. It's taken 7 years since September of 2000 for it to run up 13,000 pips which has so far peaked at the 251 level. I know the chart is not easily readable but I wanted you to be able to see the falls that took place since 1980. You can pull up your own chart to view some of these points in detail if you're interested.
This is at least the third time I've posted this chart in the last few weeks. Please take note of the correlation between the peaking of RSI over the 70 line and the subsequent falls which took place. (By the way, I'm not here to argue whether or not 70 delineates overboughtness on the RSI. Frankly I don't care if it's considered overbought or not. The point is that once it peaks over 70 a major fall usually occurs). I have also laid down some fibs on this chart which I hadn't done before. A retracement to the 23.6 Fib alone would take it to around 227. The 38.2 Fib would be around 212. The 50 Fib would take it all the way down to 200. Seems impossible, I know, especially with the carry trades, but this beast was trading under 200 less than 2 years ago when I first started live trading the forex. A 50% retacement impossible? The last major retacement from the 1995 to 1998 run up actually surpassed the 61.8 Fib. It took 3 years for it to run up 11,000 pips and only 2 years to run down past the 61.8 level. It's taken 7 years since September of 2000 for it to run up 13,000 pips which has so far peaked at the 251 level. I know the chart is not easily readable but I wanted you to be able to see the falls that took place since 1980. You can pull up your own chart to view some of these points in detail if you're interested.
M2B
Ignored
Yes, I remember your post, I think last week sometime was the last time.
Interesting.......
|
Joined Jul 2007
|
Status: World is Flat
|94 Posts
I feel nervous with this pair now since the next support level seems around 236 and with the DOW down 380 points and asia to follow suit, it could be long night of low downs or reversal. But, it is itching to fall down big time...
It is the calm before the storm or just a fake trend.... Time will tell....
This is at least the third time I've posted this chart in the last few weeks. Please take note of the correlation between the peaking of RSI over the 70 line and the subsequent falls which took place. (By the way, I'm not here to argue whether or not 70 delineates overboughtness on the RSI. Frankly I don't care if it's considered overbought or not. The point is that once it peaks over 70 a major fall usually occurs). I have also laid down some fibs on this chart which I hadn't done before. A retracement to the 23.6 Fib alone would take it to around 227. The 38.2 Fib would be around 212. The 50 Fib would take it all the way down to 200. Seems impossible, I know, especially with the carry trades, but this beast was trading under 200 less than 2 years ago when I first started live trading the forex. A 50% retracement impossible? The last major retracement from the 1995 to 1998 run up actually surpassed the 61.8 Fib. It took 3 years for it to run up 11,000 pips and only 2 years to run down past the 61.8 level. It's taken 7 years since September of 2000 for it to run up 13,000 pips which has so far peaked at the 251 level. I know the chart is not easily readable but I wanted you to be able to see the falls that took place since 1980. You can pull up your own chart to view some of these points in detail if you're interested.
M2B
Ignored
Picture make sense, but numbers are not readable.
What is your RSI setting number on this chart?
Picture make sense, but numbers are not readable.
What is your RSI setting number on this chart?
Ignored
RSI is set at 9 but that doesn't really matter as far as the information in the post is concerned. My point is simply to look at how the pair has responded in correlation to the RSI. You can set the RSI at whatever level you want and you are going to get the same 'correlation'.
This is at least the third time I've posted this chart in the last few weeks. Please take note of the correlation between the peaking of RSI over the 70 line and the subsequent falls which took place. (By the way, I'm not here to argue whether or not 70 delineates overboughtness on the RSI. Frankly I don't care if it's considered overbought or not. The point is that once it peaks over 70 a major fall usually occurs). I have also laid down some fibs on this chart which I hadn't done before. A retracement to the 23.6 Fib alone would take it to around 227. The 38.2 Fib would be around 212. The 50 Fib would take it all the way down to 200. Seems impossible, I know, especially with the carry trades, but this beast was trading under 200 less than 2 years ago when I first started live trading the forex. A 50% retracement impossible? The last major retracement from the 1995 to 1998 run up actually surpassed the 61.8 Fib. It took 3 years for it to run up 11,000 pips and only 2 years to run down past the 61.8 level. It's taken 7 years since September of 2000 for it to run up 13,000 pips which has so far peaked at the 251 level. I know the chart is not easily readable but I wanted you to be able to see the falls that took place since 1980. You can pull up your own chart to view some of these points in detail if you're interested.
M2B
Ignored
I think it is very possible you are right (but then I am Mr. Bear)
i just closed out my longs i had and collected my swap from my 239.10 entries. The day is over for me. this is my record day of over 2100 pips on this one day! i will sleep very good tonight!