DislikedI use these. I break the different time frame into segments. I'll take the open of that time frame, meaning that with the period seperators vertical lines on, I take it from the open of the new period.
So only a weekly time frame, I use the open of the new year. I'll draw a horizontal line, then lines above and below at 360 pip intervals. Using your fibo channel tool it's easier.
I then take the daily time frame, and draw a horizontal line on the open of the new month, then again pips above and below at 180 pip intervals.
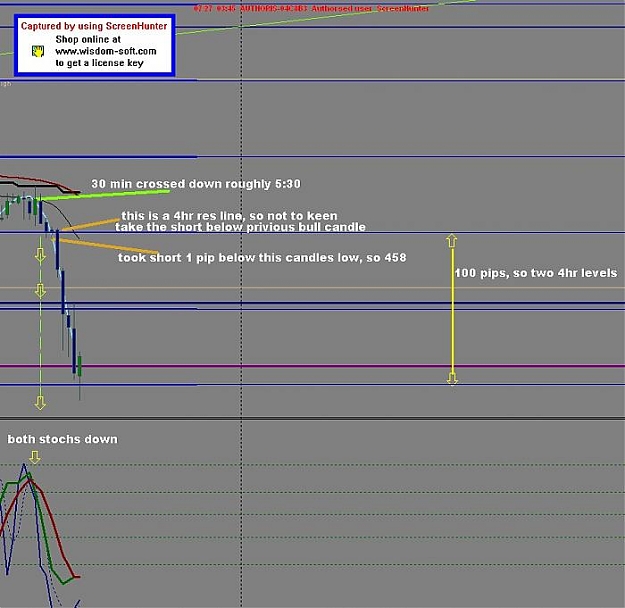
Then on the 4hr time frame, again horizontal line at weekly open and horizontal lines 50 pip intervals up and down.
I will also only use one fib retracement, and that is from the high to low of last week. Or low to high depending on which way the trend went.
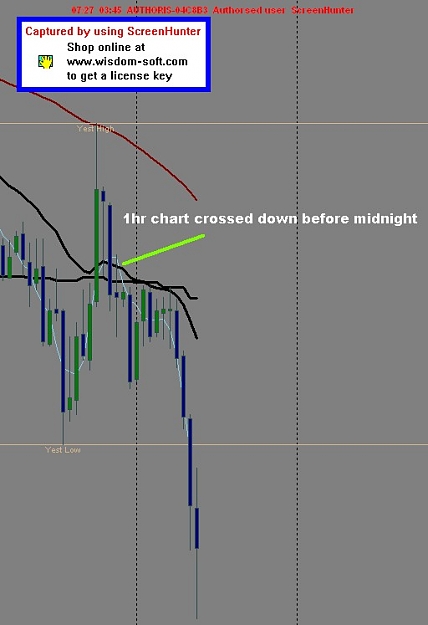
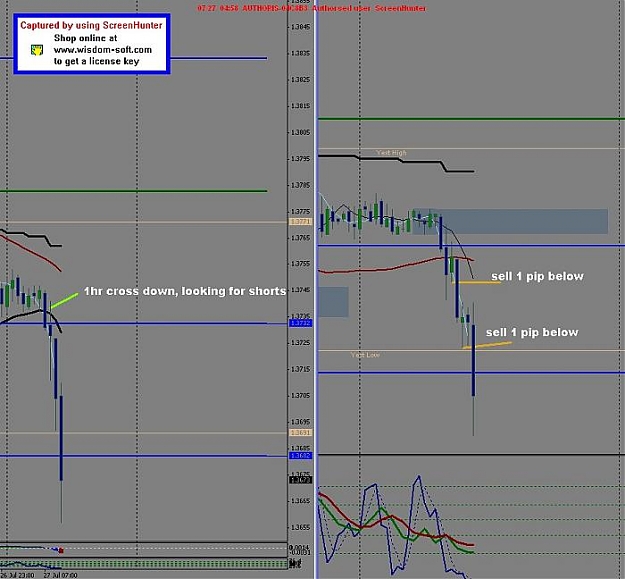
Picture 090 will get explained n next post.Ignored
How did you arrive at the intervals of 360 for weekly and 180 for daily chart?