I assume everybody knows how to enter and exit the market but don't know a few rules that related to Money management.
Such as;
i - where to enter & exit with Money management,
ii- where to display stop loss with Money management,
iii- how to diversify the account with Money management (Scale),
iv- how much we can risk our account.
The website for Pivot Point;
http://www.actionforex.com/forex_ana..._200603215756/
1) Where to enter & Exit;
Everybody has own way of enter in to the market. No body can say the way you enter the trade is wrong. But, it's depend on how long you want to hold the market if the time that you enter the trade is non active market.
The best time to enter the trades are during London Session and New York session.
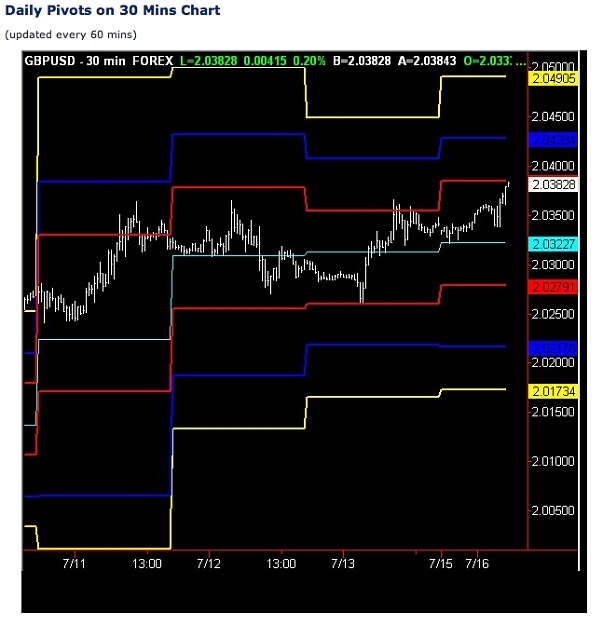
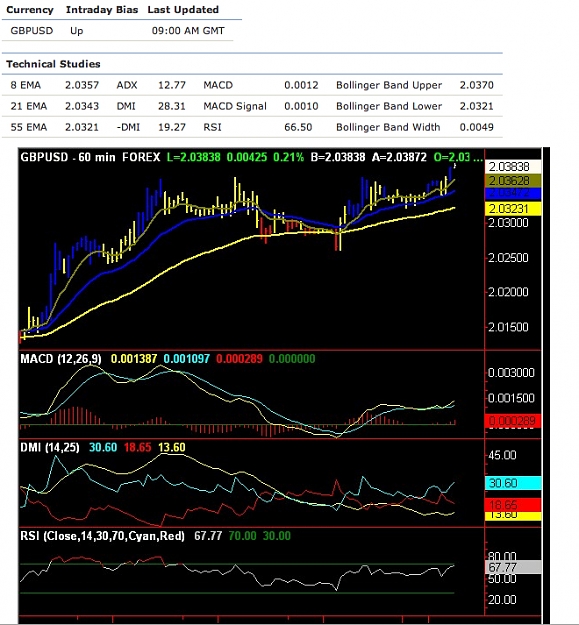
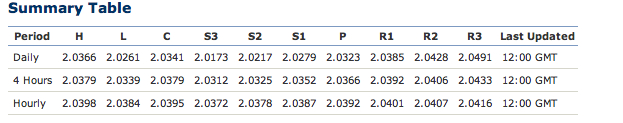
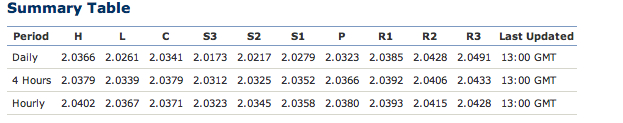
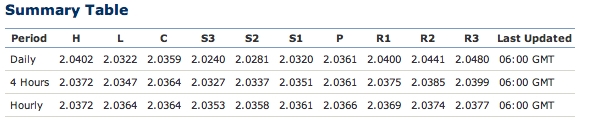
Once we know when is the best time to trade, we should know what is the trend for the day. The easy way to find the direction of the trend for the days is using the Pivot Point (PP). If the opening price is above the PP means Bullish. If the opening price is below the PP means Bearish.
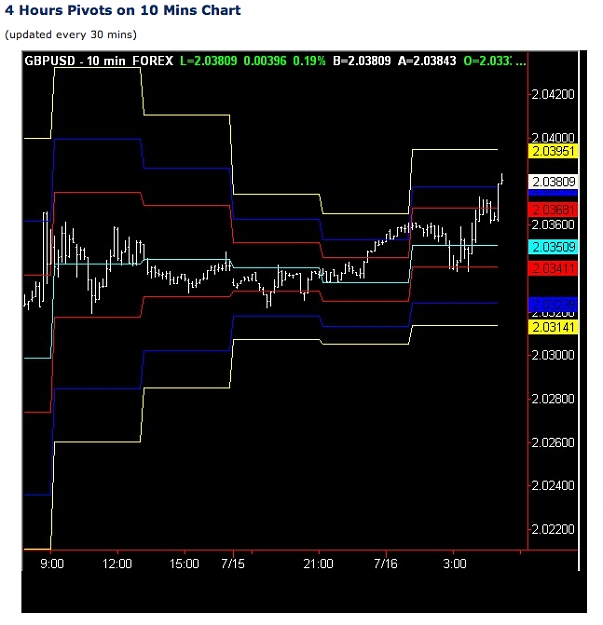
Now we have to find out what price to enter. Using the PP level at Daily, 4 hours, hourly will help us to place an entry.
Entry Strategy;
If the price above the PP level Daily, 4 hrs, hourly, we can enter at R1 hourly PP.
If the price below the PP level Daily, 4 hrs, hourly, we can enter at S1 hourly PP.
................................................
The most difficult part is where to exit. We always say, we want to let the profit run until maximum level. How do we know the maximum level?. The PP will came-in as a leading indicator. This is one of the way we can discipline ourself.
Exit Strategy;
For buy - use 4 hours PP level (R1,R2,R3) for exit level,
For sell - use 4 hours PP level (S1,S2,S3) for exit level.
2). Where to display stop loss;
Before we can start trading our money into the market, We should ask ourself. How much we willing to lost. We can use PP to display the Stop Loss (SL).
There are 2 way we can place the SL;
a). If the entry using 4 hrs than the SL also at 4 hrs PP,
b). If the entry using hourly than the SL also at hourly PP.
When the price reach at R2/S2 level, the SL will move to R1/S1 and so on..
3). How to diversify the account (Scale);
This is the most important part of Money Management. I like to name it as a scale strategy. Scale strategy can be use in any range of market. I realise that this method help a lot on to diversity our account with affective and efficient.
For Mini Account;
1 lot = 10 units
or
1 lot = 100 units
For Normal Account;
1 lot = 1000 units;
or
1 lot = 10,000 units
The strategy;
For Bullish, look for the range from R1 to R3, or
For Bearish, look for the range from S1 to S3
Example 1:
Let's say the range between R1 to R3 or S1 to S3 (4 hrs pivot) is 40.
So we can do scalling to 2 target;
1st target at 20 pips, the 2nd target at 20 pips.
We plan for this range with 1 lot for every 20 pips;
It's mean, We can buy 2 lots.
1st lot close 20 pips at target 1,
2nd lot close 20 pips at target 2
Take your profit every 20 pips move. Every 20 pips take 1 lot. Once the 1st profit taken, move the SL at break even (b/e) or +3.
For the range 50 or 60;
Scale = 20/20/10 or 20/20/20 (3 lots)
(SL move to b/e after 1st lot taken, after the 2nd lots taken, move the SL at target 1.)
For the range 70 or 80;
Scale = 20/20/20/10 or 20/20/20/20 (4 lots)
(SL move to b/e after 1st lot taken, after the 2nd lots taken, move the SL at target 1 price, than when the 3rd lots taken move the SL at target 2)
For the range 90 or 100;
Scale =20/20/20/20/10 or 20/20/20/20/20 (5 lots)
(SL move to b/e after 1st lot taken, after the 2nd lots taken, move the SL at target 1 price, than when the 3rd lots taken move the SL at target 2, after the 4th lots take move the SL at target 3)
4). How much we can risk our account;
We should know the size of our account that available for us to trade.
The Ratio that suitable for each trader also different.
For those still in mini account, try to use ratio 1:1 or 5:1
For those experience trader can use 10:1 or 50:1
Use this calculator, to find out how much the size of account that we can expose.
http://www.oanda.com/products/fxmath...vailable.shtml
5). Technical Indicator;
Try to use 2 to 3 Technical Indicator only.
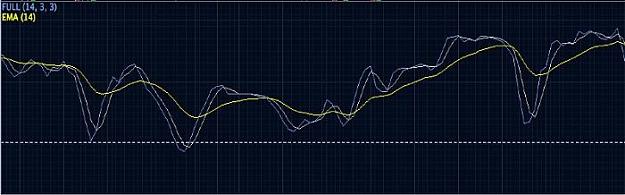
Stochastic 14,3,3 + EMA14 (plot EMA 14 inside the Stochastic 14,3,3)
This indicator use to looking for retracement.
How to use the Stochastic?
Use this Stochastic to see the retracement level.
Look for new cross.
For bullish;
Try to take new cross from below 50 level to upward.
If the cross happen at above 50 to upward, the bullish continue but not that big move. This can be use as a signal for overbought.
For bearish;
Try to take new cross from above 50 level to downward.
If the cross happen at below 50 level to downward, the bearish continue but not that big move. This can be as a signal for oversold.
How stochastic work with EMA14?
When the stochastic cross with EMA14, this can be a 2nd confirmation for entry and exit.
At chart 15 minutes.
The looks will be like this;
Such as;
i - where to enter & exit with Money management,
ii- where to display stop loss with Money management,
iii- how to diversify the account with Money management (Scale),
iv- how much we can risk our account.
The website for Pivot Point;
http://www.actionforex.com/forex_ana..._200603215756/
1) Where to enter & Exit;
Everybody has own way of enter in to the market. No body can say the way you enter the trade is wrong. But, it's depend on how long you want to hold the market if the time that you enter the trade is non active market.
The best time to enter the trades are during London Session and New York session.
Once we know when is the best time to trade, we should know what is the trend for the day. The easy way to find the direction of the trend for the days is using the Pivot Point (PP). If the opening price is above the PP means Bullish. If the opening price is below the PP means Bearish.
Now we have to find out what price to enter. Using the PP level at Daily, 4 hours, hourly will help us to place an entry.
Entry Strategy;
If the price above the PP level Daily, 4 hrs, hourly, we can enter at R1 hourly PP.
If the price below the PP level Daily, 4 hrs, hourly, we can enter at S1 hourly PP.
................................................
The most difficult part is where to exit. We always say, we want to let the profit run until maximum level. How do we know the maximum level?. The PP will came-in as a leading indicator. This is one of the way we can discipline ourself.
Exit Strategy;
For buy - use 4 hours PP level (R1,R2,R3) for exit level,
For sell - use 4 hours PP level (S1,S2,S3) for exit level.
2). Where to display stop loss;
Before we can start trading our money into the market, We should ask ourself. How much we willing to lost. We can use PP to display the Stop Loss (SL).
There are 2 way we can place the SL;
a). If the entry using 4 hrs than the SL also at 4 hrs PP,
b). If the entry using hourly than the SL also at hourly PP.
When the price reach at R2/S2 level, the SL will move to R1/S1 and so on..
3). How to diversify the account (Scale);
This is the most important part of Money Management. I like to name it as a scale strategy. Scale strategy can be use in any range of market. I realise that this method help a lot on to diversity our account with affective and efficient.
For Mini Account;
1 lot = 10 units
or
1 lot = 100 units
For Normal Account;
1 lot = 1000 units;
or
1 lot = 10,000 units
The strategy;
For Bullish, look for the range from R1 to R3, or
For Bearish, look for the range from S1 to S3
Example 1:
Let's say the range between R1 to R3 or S1 to S3 (4 hrs pivot) is 40.
So we can do scalling to 2 target;
1st target at 20 pips, the 2nd target at 20 pips.
We plan for this range with 1 lot for every 20 pips;
It's mean, We can buy 2 lots.
1st lot close 20 pips at target 1,
2nd lot close 20 pips at target 2
Take your profit every 20 pips move. Every 20 pips take 1 lot. Once the 1st profit taken, move the SL at break even (b/e) or +3.
For the range 50 or 60;
Scale = 20/20/10 or 20/20/20 (3 lots)
(SL move to b/e after 1st lot taken, after the 2nd lots taken, move the SL at target 1.)
For the range 70 or 80;
Scale = 20/20/20/10 or 20/20/20/20 (4 lots)
(SL move to b/e after 1st lot taken, after the 2nd lots taken, move the SL at target 1 price, than when the 3rd lots taken move the SL at target 2)
For the range 90 or 100;
Scale =20/20/20/20/10 or 20/20/20/20/20 (5 lots)
(SL move to b/e after 1st lot taken, after the 2nd lots taken, move the SL at target 1 price, than when the 3rd lots taken move the SL at target 2, after the 4th lots take move the SL at target 3)
4). How much we can risk our account;
We should know the size of our account that available for us to trade.
The Ratio that suitable for each trader also different.
For those still in mini account, try to use ratio 1:1 or 5:1
For those experience trader can use 10:1 or 50:1
Use this calculator, to find out how much the size of account that we can expose.
http://www.oanda.com/products/fxmath...vailable.shtml
5). Technical Indicator;
Try to use 2 to 3 Technical Indicator only.
Stochastic 14,3,3 + EMA14 (plot EMA 14 inside the Stochastic 14,3,3)
This indicator use to looking for retracement.
How to use the Stochastic?
Use this Stochastic to see the retracement level.
Look for new cross.
For bullish;
Try to take new cross from below 50 level to upward.
If the cross happen at above 50 to upward, the bullish continue but not that big move. This can be use as a signal for overbought.
For bearish;
Try to take new cross from above 50 level to downward.
If the cross happen at below 50 level to downward, the bearish continue but not that big move. This can be as a signal for oversold.
How stochastic work with EMA14?
When the stochastic cross with EMA14, this can be a 2nd confirmation for entry and exit.
At chart 15 minutes.
The looks will be like this;
Attached Image (click to enlarge)