Hi.
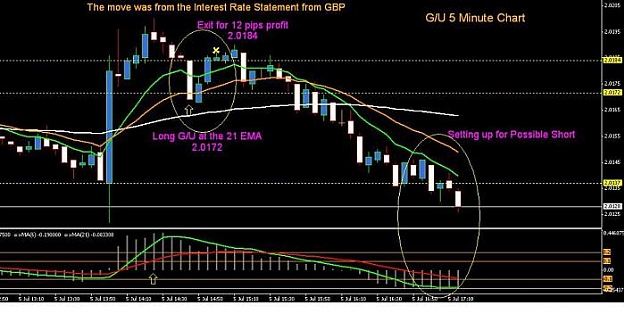
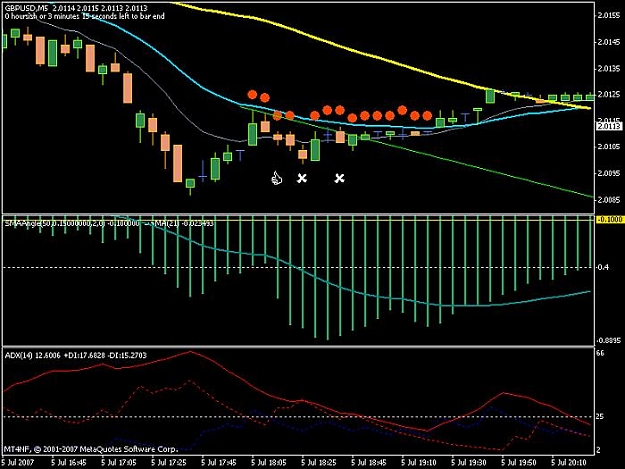
Balkan's post earlier prompted me to call up the Swissy chart he was on about, and I found it interesting for one or two different reasons. Look at the first chart.
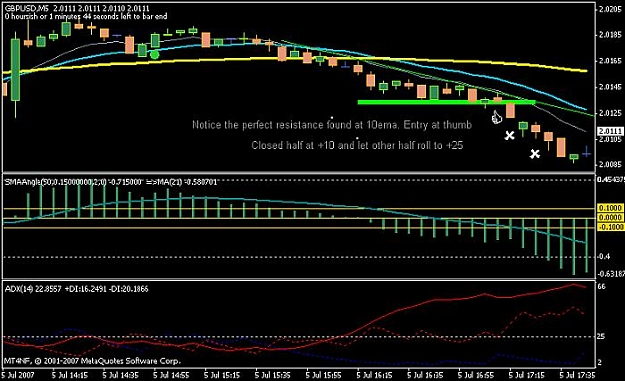
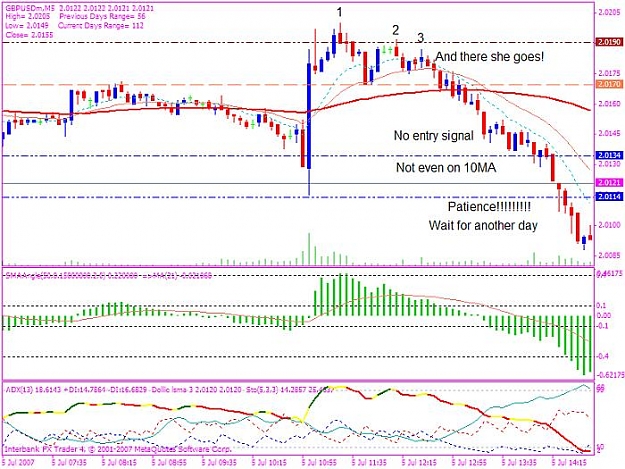
About the time that Balkan entered his trade, the price was about half and half with S3, the very last support in this Pivot line. This illustrates one of the drawbacks of Pivots.......due to a slow day yesterday, today's Pivots end up very close together, not giving much room for targets etc. The argument for or against entering the trade is open to debate; personally, I wouldn't have entered the trade without a clear target to aim for. Below S3, there's a big empty space, and as far as I'm concerned, needs filling with something. Yes, I know that 10 pips seem to be the norm, but there's always the chance of a few more, isn't there? Let's be honest. With that in mind, have a look at the second chart.
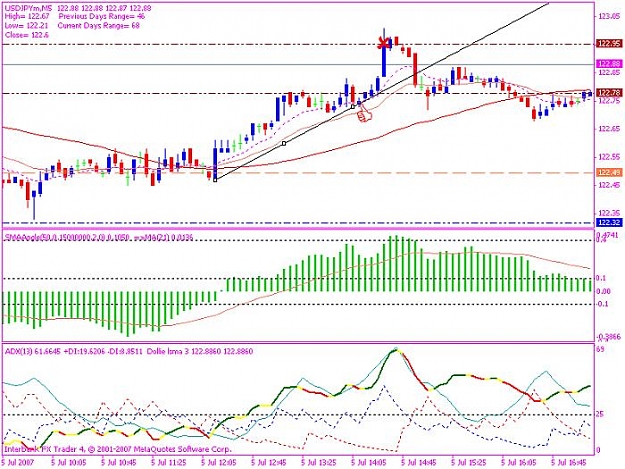
I've replaced the Pivot Points with something called "ATM_DSRBeats", an indicator I came upon quite by accident. When the Pivot Point situation is like today's, if there's a danger of the price going above R3 or below S3, then I replace them with the "Beats", and as you can see, they fill in rather neatly. They're all 15 pips apart, and seem to gel nicely with the price. Don't ask me how it works.........it just does, and that'll do for me! I've attached it so that anyone who wants to can have a play around with it.
And now I've typed all that, let's hope it all ends up ok when I post it!!
Cheers
Balkan's post earlier prompted me to call up the Swissy chart he was on about, and I found it interesting for one or two different reasons. Look at the first chart.
About the time that Balkan entered his trade, the price was about half and half with S3, the very last support in this Pivot line. This illustrates one of the drawbacks of Pivots.......due to a slow day yesterday, today's Pivots end up very close together, not giving much room for targets etc. The argument for or against entering the trade is open to debate; personally, I wouldn't have entered the trade without a clear target to aim for. Below S3, there's a big empty space, and as far as I'm concerned, needs filling with something. Yes, I know that 10 pips seem to be the norm, but there's always the chance of a few more, isn't there? Let's be honest. With that in mind, have a look at the second chart.
I've replaced the Pivot Points with something called "ATM_DSRBeats", an indicator I came upon quite by accident. When the Pivot Point situation is like today's, if there's a danger of the price going above R3 or below S3, then I replace them with the "Beats", and as you can see, they fill in rather neatly. They're all 15 pips apart, and seem to gel nicely with the price. Don't ask me how it works.........it just does, and that'll do for me!
And now I've typed all that, let's hope it all ends up ok when I post it!!
Cheers
Attached Image (click to enlarge)
Attached Image

Attached File(s)