AUDUSD Climbs Higher: A Look into the Bullish Trend
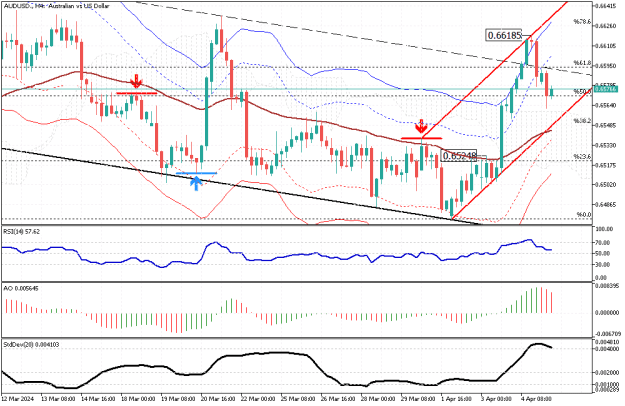
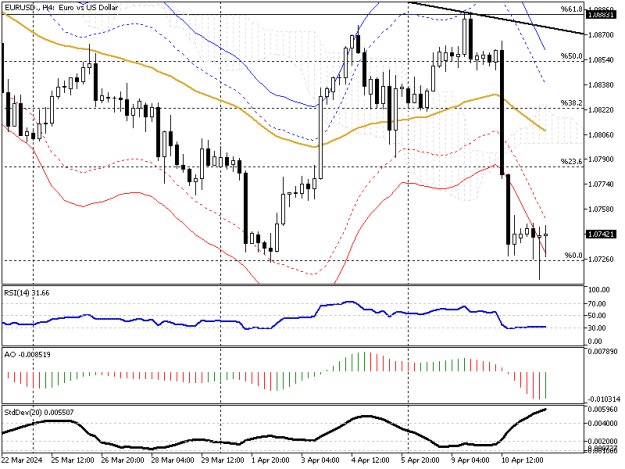
Solid ECN – Yesterday, the Australian dollar saw a significant rise against the U.S. dollar. This increase in value started when it surpassed the EMA 50 and reached 0.6524, marked by a large bullish candle. Following this, there were four more strong bullish candles, pushing the price beyond the Envelopes band, suggesting the market was in an overbought state. This was further supported by the RSI indicator moving above 70.
Today, the market is correcting itself slightly after reaching a high of 0.661 on Thursday. Currently, the AUD/USD pair is trading around 0.657, still above the 50% Fibonacci support level, and maintaining its position over the Ichimoku Cloud. Despite technical indicators showing a bearish trend, the overall outlook remains bullish as long as the price stays above the cloud and the EMA 50.
The AUD/USD price might climb further to challenge the 78.6% Fibonacci resistance level at 0.6626, moving towards the top of the bullish channel shown in red on the 4-hour chart for AUD/USD.
However, if the price falls below the EMA 50 or the 38.2% Fibonacci support level at 0.5548, this would signal an end to the bullish trend.
https://solidecn.com >>> %15 Bonus | Swap Free | Raw Spread
Attached Image (click to enlarge)
Solid ECN – Yesterday, the Australian dollar saw a significant rise against the U.S. dollar. This increase in value started when it surpassed the EMA 50 and reached 0.6524, marked by a large bullish candle. Following this, there were four more strong bullish candles, pushing the price beyond the Envelopes band, suggesting the market was in an overbought state. This was further supported by the RSI indicator moving above 70.
Today, the market is correcting itself slightly after reaching a high of 0.661 on Thursday. Currently, the AUD/USD pair is trading around 0.657, still above the 50% Fibonacci support level, and maintaining its position over the Ichimoku Cloud. Despite technical indicators showing a bearish trend, the overall outlook remains bullish as long as the price stays above the cloud and the EMA 50.
The AUD/USD price might climb further to challenge the 78.6% Fibonacci resistance level at 0.6626, moving towards the top of the bullish channel shown in red on the 4-hour chart for AUD/USD.
However, if the price falls below the EMA 50 or the 38.2% Fibonacci support level at 0.5548, this would signal an end to the bullish trend.
https://solidecn.com >>> %15 Bonus | Swap Free | Raw Spread