This week EURUSD has shown some really interesting timeless examples of market profile day-to-day categories/types and how they all relate to Auction Market Theory. After this I have a complete Auction Market Theory + Market Profile based trade breakdown that took place today!
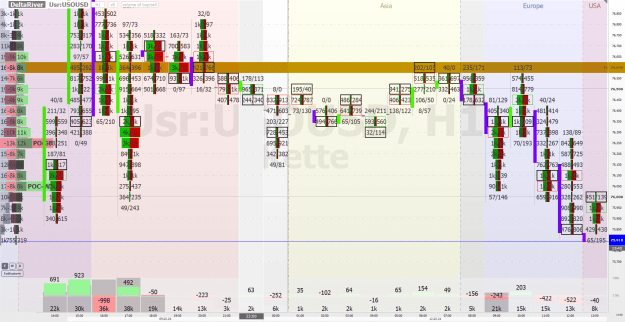
Starting from Tuesday 6th February 2024, each day was in a balanced state, price was moving higher obviously in the first two days but on the third (Friday 8th February) this was less obvious. Price broke the prior day’s low but value was still higher, therefore buyers were slightly more in control!
To start let's refer to one of the original books on Market Profile and Auction Market Theory, Mind Over Markets, 2nd Edition, by James F. Dalton:
“Value-Area Placement
A structural indicator that helps us better refine the level of directional performance is value-area placement. Through an evaluation of the relationship of one day’s value area to the next, we can move beyond simply determining if the market is doing a good job, to how good of a job it is doing. In other words, if attempted direction is up and volume is healthy, what impact does that have on value? Were buyers successful in placing value higher? How successful were they? Was value unchanged, overlapping-to higher, or completely higher?
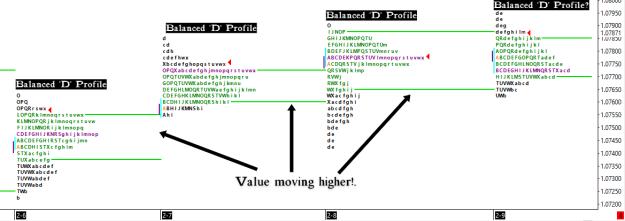
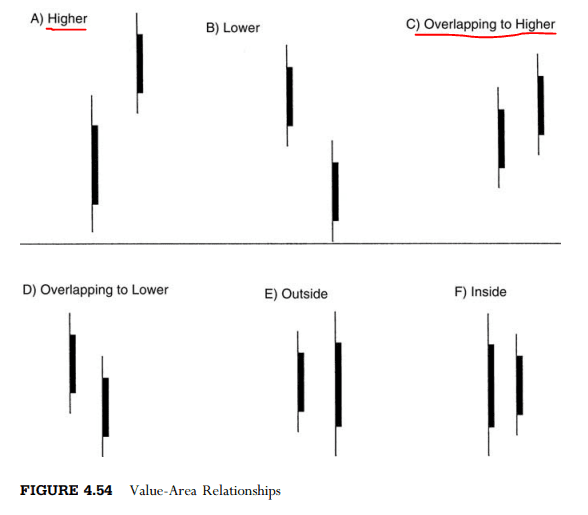
Let us briefly describe the different relationships that can exist between two trading sessions’ value areas. First, value can form clearly higher or clearly lower, exhibiting obvious directional performance. Second, value can overlap to one side or the other, indicating a lesser degree of change. Third, when the value area is contained entirely within the previous day’s value area, it is known as an inside day. The market is in balance and is not facilitating trade with either participant. Finally, an outside day occurs when a day’s value area overlaps the previous day’s value area on both extremes, and represents greater trade facilitation. Much like a Neutral day, if an outside day closes in the middle of the range, the market is in balance. If it closes on an extreme, however, there is a victor in the day timeframe battle for control. A close on the highs, for example, would indicate directional performance favoring the buyer. Figure 4.54 illustrates these common value-area relationships.”
“Evaluating Directional Performance through Combined Volume and Value-Area Placement
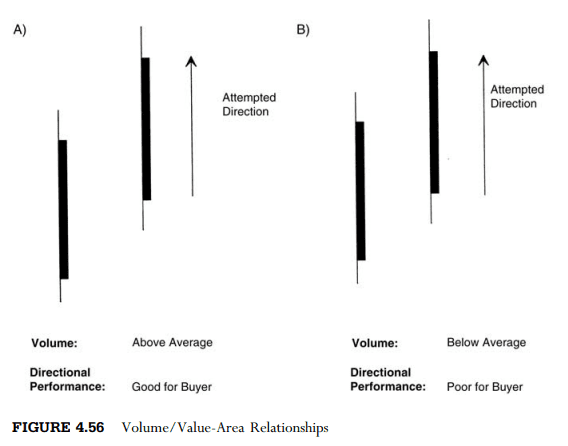
Arriving at a final evaluation of directional performance is like baking a cake—layer by layer. First, we must define attempted direction. Second, we evaluate trade facilitation according to volume. And finally, we must determine the relative success of that trade facilitation according to its impact on value-area placement. In general, if attempted direction is up, volume is above average (or at least average) and value is higher, then the market is successfully facilitating trade at higher prices. However, if attempted direction is up and volume is lower, then higher prices are cutting off activity—the buying auctions are resulting in poor trade facilitation. If the buying attempts also result in lower value, then the other timeframe seller is still in control of the market, despite day timeframe buyer dominance. The market must then move lower to resume balanced trade, much like the aforementioned movie theater”
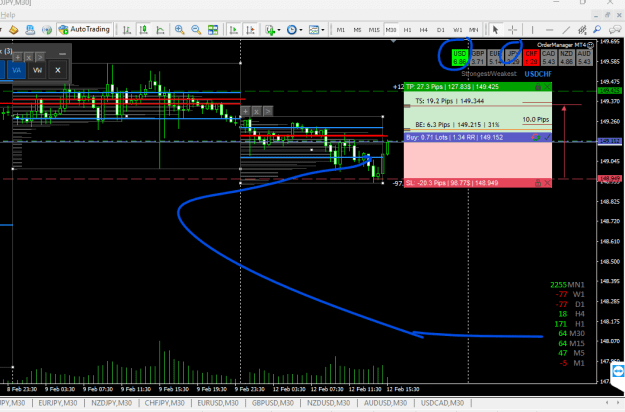
That concludes the theory / education part of this post, now for a real trade breakdown that I placed today and am still currently In:
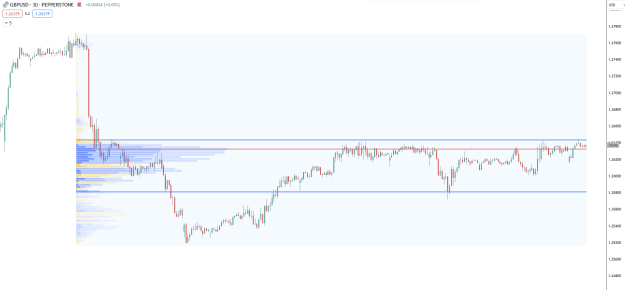
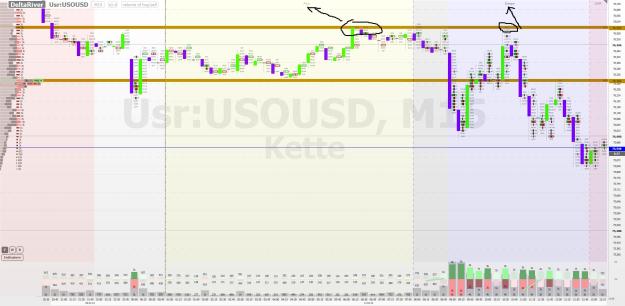
Today, Friday 9th February 2024, EURUSD created an Initial Balance and Opening Range within Thursday’s value area (the last profile on the far right in the first screenshot). This could be a market starting to balance out, in terms of price and value!
The following is from my trading journal for today:
Friday - 09/02/2024 - 2:20PM %
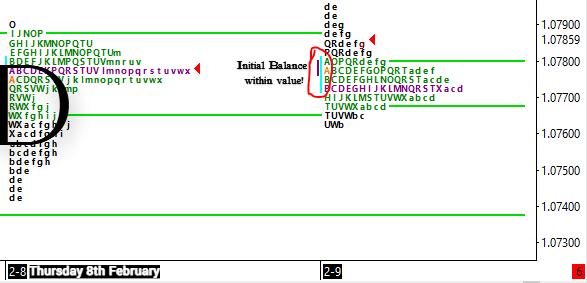
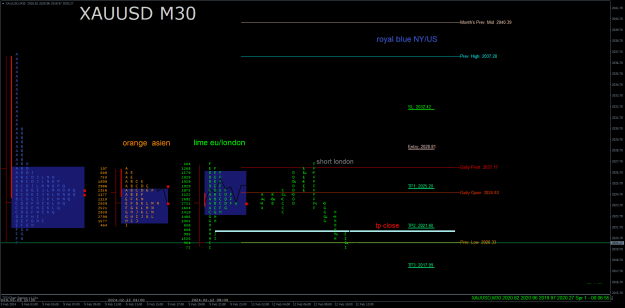
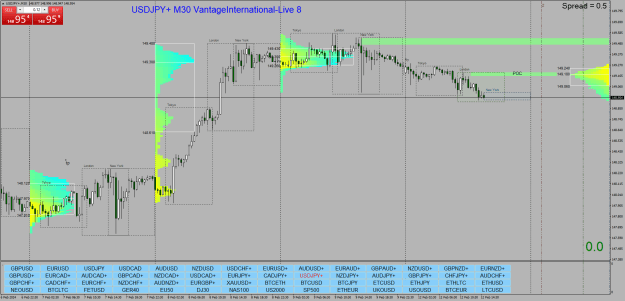
On Thursday 8th February 2024 EURUSD created a vague balanced ‘D’ distribution market profile. The following day, just after rollover, price went on to open and stay within Thursday’s value area. According to Auction Market Theory, this is a balanced market that has continued to show its balance into the open. Knowing this, we start the day off with a responsive activity mindset.
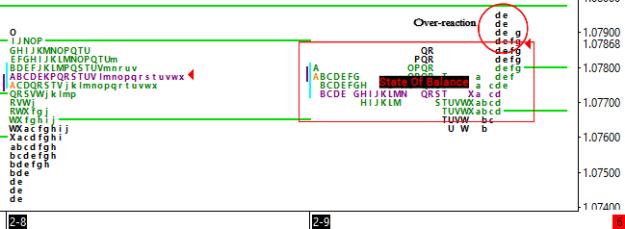
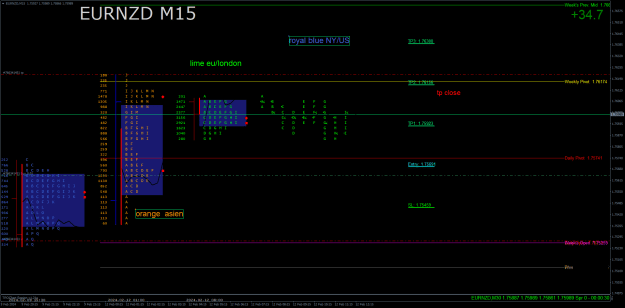
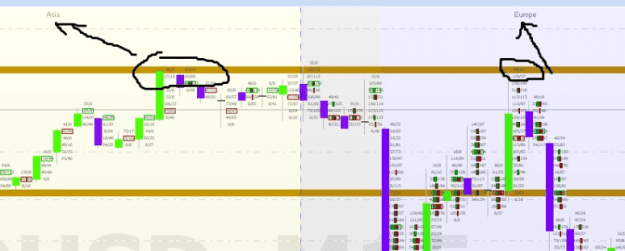
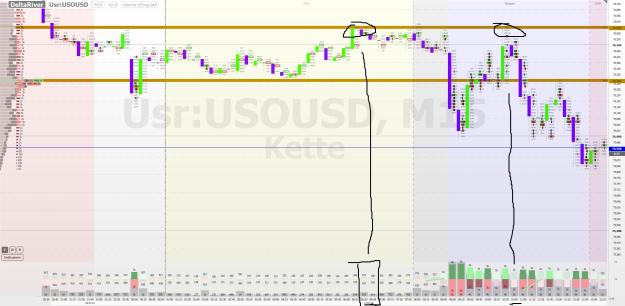
As the day progressed price remained contained within the prior day’s Value Area, auctioning back and forth between the Value Area High & Low. Eventually price broke the high of the prior day’s trading range. I believe this is the result of the ever increasing noise of today’s markets and not the result of initiative activity. So I start by looking to fade this move away from value, looking for responsive activity via Order Flow:
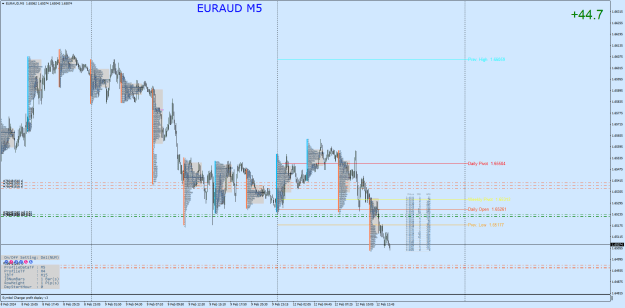
The first spike (too volatile due to CAD news) had no obvious confirmations to sell apart from the accumulation; heavy volumes on multiple levels. The 2nd reaction had limit sell orders at the top of the range, followed by a bearish engulfing candle with several inverted imbalances within and a negative delta. This met all conformations to enter a short position, expecting further responsive activity.
The Stop Loss was placed above the high with a fixed Risk-Reward ratio of 1:1.75
If neither the stop loss or take profit have been hit, I will cover the position just before market close because we are going into the weekend and as such there is significant gap risk when holding a position. I will update the post on the trade outcome.
Update: Exited at a very small profit, just over breakeven, at 9:55PM
Trade safe,
MM
Attached Image (click to enlarge)
Starting from Tuesday 6th February 2024, each day was in a balanced state, price was moving higher obviously in the first two days but on the third (Friday 8th February) this was less obvious. Price broke the prior day’s low but value was still higher, therefore buyers were slightly more in control!
To start let's refer to one of the original books on Market Profile and Auction Market Theory, Mind Over Markets, 2nd Edition, by James F. Dalton:
“Value-Area Placement
A structural indicator that helps us better refine the level of directional performance is value-area placement. Through an evaluation of the relationship of one day’s value area to the next, we can move beyond simply determining if the market is doing a good job, to how good of a job it is doing. In other words, if attempted direction is up and volume is healthy, what impact does that have on value? Were buyers successful in placing value higher? How successful were they? Was value unchanged, overlapping-to higher, or completely higher?
Let us briefly describe the different relationships that can exist between two trading sessions’ value areas. First, value can form clearly higher or clearly lower, exhibiting obvious directional performance. Second, value can overlap to one side or the other, indicating a lesser degree of change. Third, when the value area is contained entirely within the previous day’s value area, it is known as an inside day. The market is in balance and is not facilitating trade with either participant. Finally, an outside day occurs when a day’s value area overlaps the previous day’s value area on both extremes, and represents greater trade facilitation. Much like a Neutral day, if an outside day closes in the middle of the range, the market is in balance. If it closes on an extreme, however, there is a victor in the day timeframe battle for control. A close on the highs, for example, would indicate directional performance favoring the buyer. Figure 4.54 illustrates these common value-area relationships.”
Attached Image (click to enlarge)
“Evaluating Directional Performance through Combined Volume and Value-Area Placement
Arriving at a final evaluation of directional performance is like baking a cake—layer by layer. First, we must define attempted direction. Second, we evaluate trade facilitation according to volume. And finally, we must determine the relative success of that trade facilitation according to its impact on value-area placement. In general, if attempted direction is up, volume is above average (or at least average) and value is higher, then the market is successfully facilitating trade at higher prices. However, if attempted direction is up and volume is lower, then higher prices are cutting off activity—the buying auctions are resulting in poor trade facilitation. If the buying attempts also result in lower value, then the other timeframe seller is still in control of the market, despite day timeframe buyer dominance. The market must then move lower to resume balanced trade, much like the aforementioned movie theater”
Attached Image (click to enlarge)
That concludes the theory / education part of this post, now for a real trade breakdown that I placed today and am still currently In:
Today, Friday 9th February 2024, EURUSD created an Initial Balance and Opening Range within Thursday’s value area (the last profile on the far right in the first screenshot). This could be a market starting to balance out, in terms of price and value!
The following is from my trading journal for today:
Friday - 09/02/2024 - 2:20PM %
Attached Image (click to enlarge)
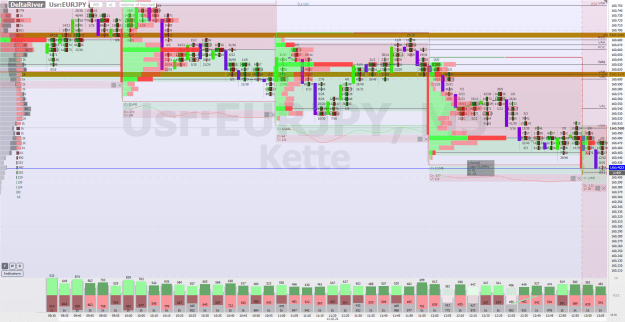
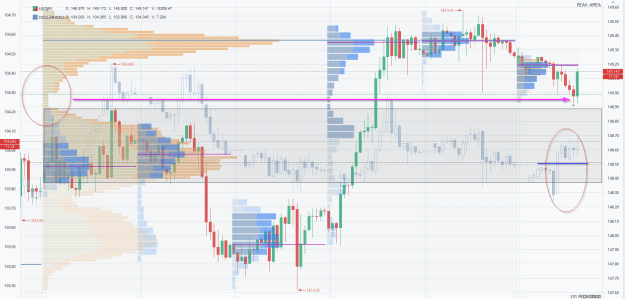
On Thursday 8th February 2024 EURUSD created a vague balanced ‘D’ distribution market profile. The following day, just after rollover, price went on to open and stay within Thursday’s value area. According to Auction Market Theory, this is a balanced market that has continued to show its balance into the open. Knowing this, we start the day off with a responsive activity mindset.
Attached Image (click to enlarge)
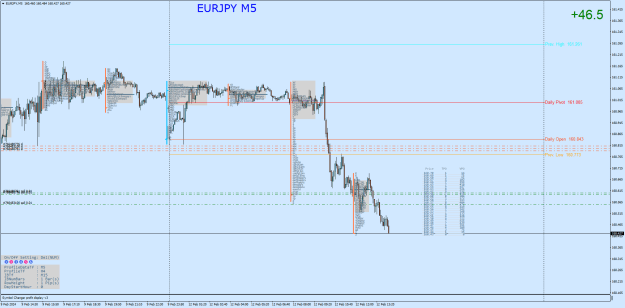
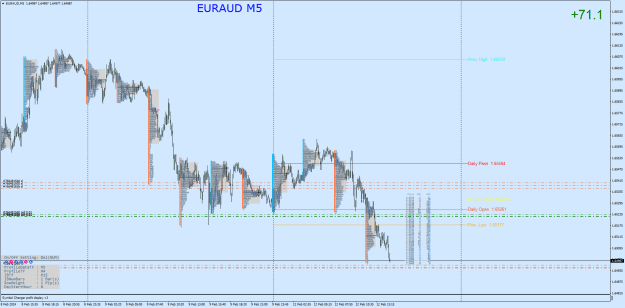
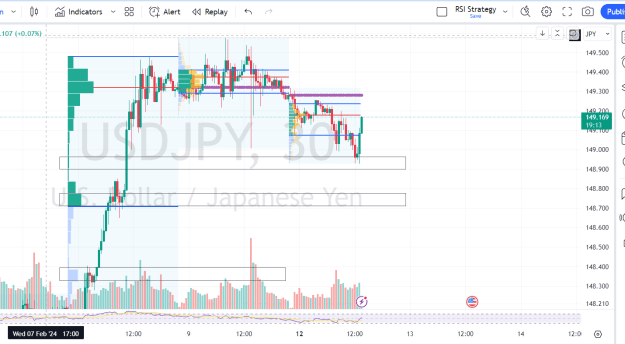
As the day progressed price remained contained within the prior day’s Value Area, auctioning back and forth between the Value Area High & Low. Eventually price broke the high of the prior day’s trading range. I believe this is the result of the ever increasing noise of today’s markets and not the result of initiative activity. So I start by looking to fade this move away from value, looking for responsive activity via Order Flow:
Attached Image (click to enlarge)
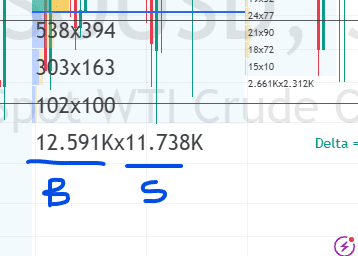
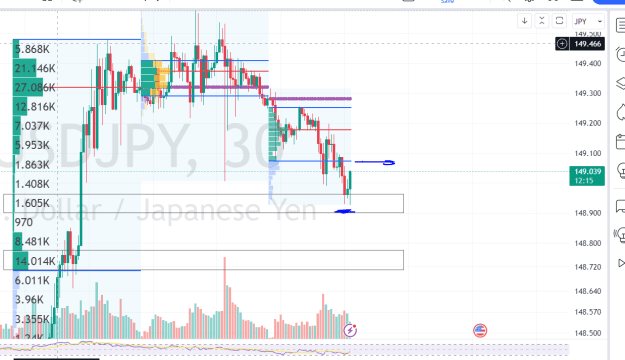
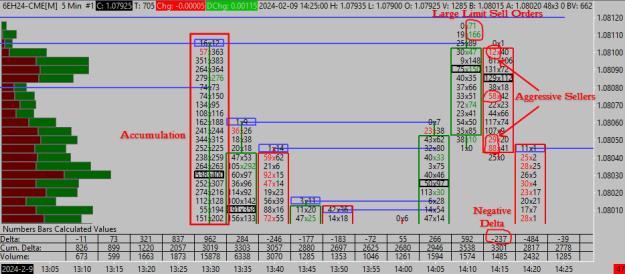
The first spike (too volatile due to CAD news) had no obvious confirmations to sell apart from the accumulation; heavy volumes on multiple levels. The 2nd reaction had limit sell orders at the top of the range, followed by a bearish engulfing candle with several inverted imbalances within and a negative delta. This met all conformations to enter a short position, expecting further responsive activity.
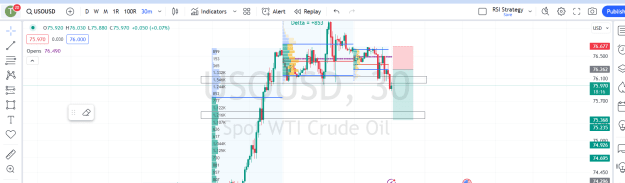
The Stop Loss was placed above the high with a fixed Risk-Reward ratio of 1:1.75
If neither the stop loss or take profit have been hit, I will cover the position just before market close because we are going into the weekend and as such there is significant gap risk when holding a position. I will update the post on the trade outcome.
Update: Exited at a very small profit, just over breakeven, at 9:55PM
Trade safe,
MM
Seeking Fair Value
2