Lets get back to basics and make some money
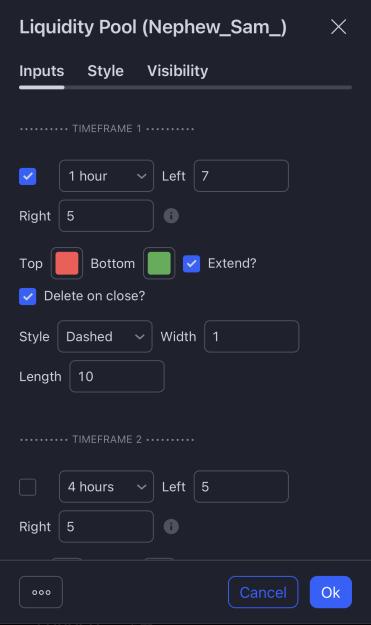
+ This system makes use of Pivot Points to identify Liquidity Pools. This simply means, highs and lows that price should eventually take out (go towards) before reacting
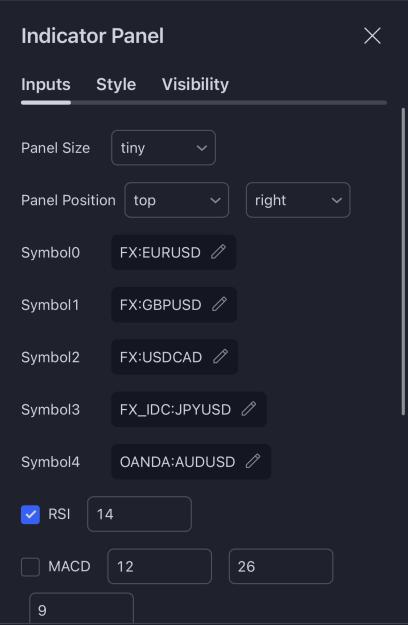
+ Technically, you don't need any special indicators for this system, but any indicators to help identify pivot points will make trading it more clear. I use this TradingView indicator
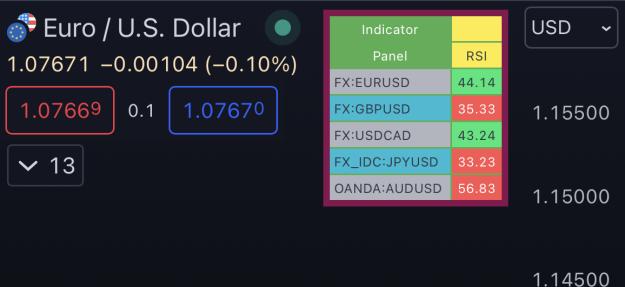
+ Don't take every trade that returns to a liquidity pool. Refine your entries using the Relative Strength Index (default settings)
+ The 15 Minute timeframe works well, but any timeframe can produce great results. The market is fractal, and there's tons of liquidity and setups regardless of the time
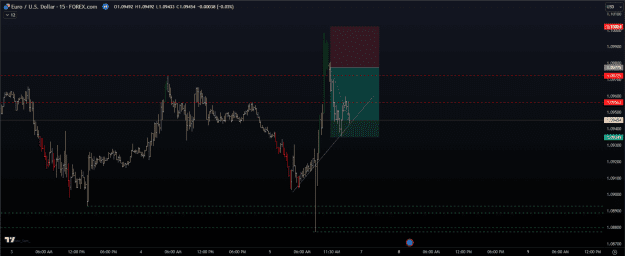
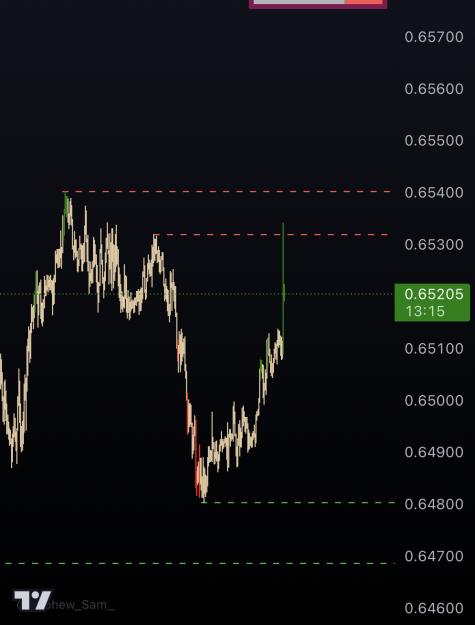
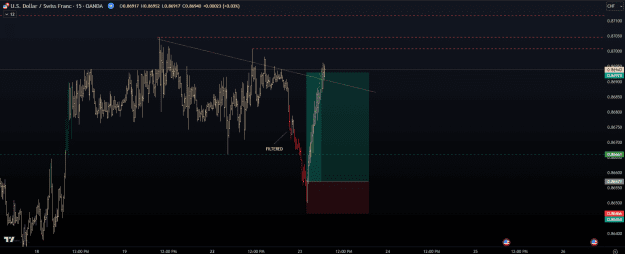
+ Entries: Wait for price to return to a Liquidity Pool, and wait for the RSI to be oversold or overbought. Enter on the first candle that exits the oversold or overbought condition
Attached Image (click to enlarge)
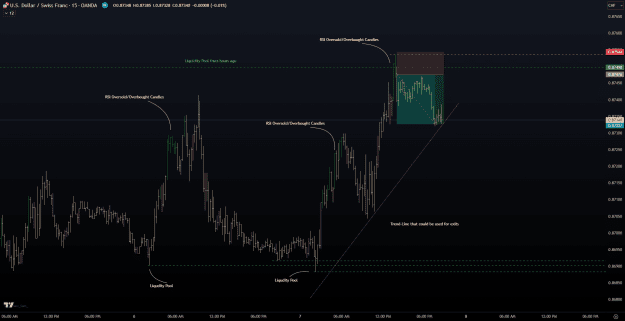
+ Exits: Use a recent swing high or low with a 1:1 or 1:2 RR. You can also draw a trendline and exit when price breaks it while using the swing point for a stop loss. If two or more Liquidity Pools are close, it could be favorable to wait for price to retrace through all pools before entering a trade
Attached Image (click to enlarge)
Attached Image (click to enlarge)

+ Notice how the FIRST RSI entry is filtered because price has not yet reached a pool. Then notice how the following RSI works perfectly
Attached Image (click to enlarge)
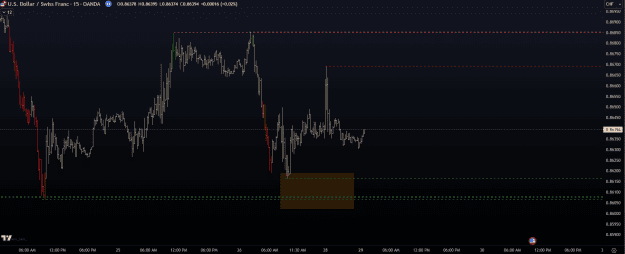
+ More Examples
Attached Image (click to enlarge)
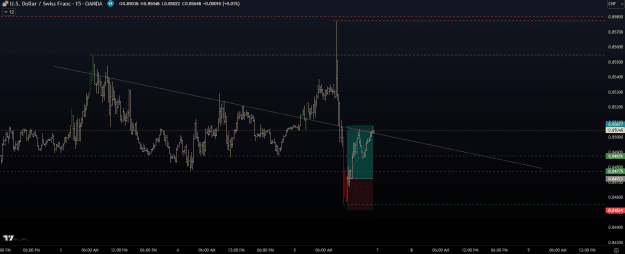
Attached Image (click to enlarge)