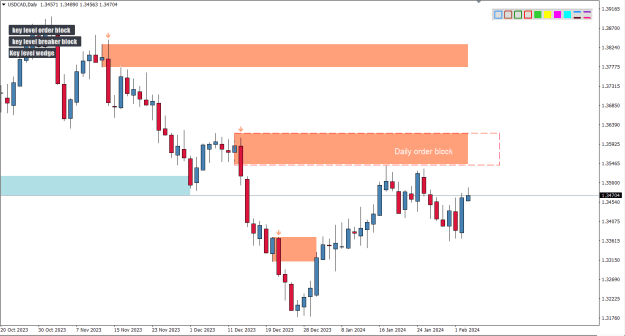
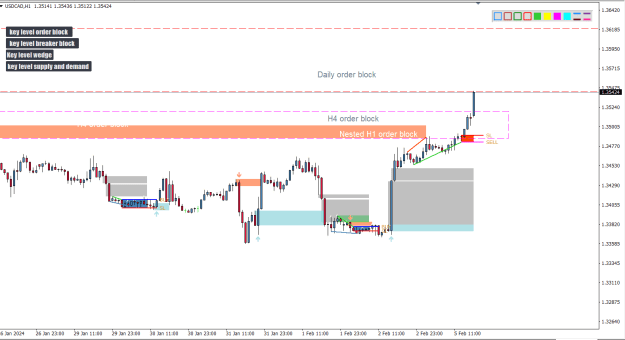
Potential Bearish Wedge trade on UsdCad H1 drawn by the key level wedge indicator
- on the 1st pic below its the daily chart we see theres a fresh order block which is not mitigated yet. so theres a chance price might want to touch there first.
Attached Image (click to enlarge)
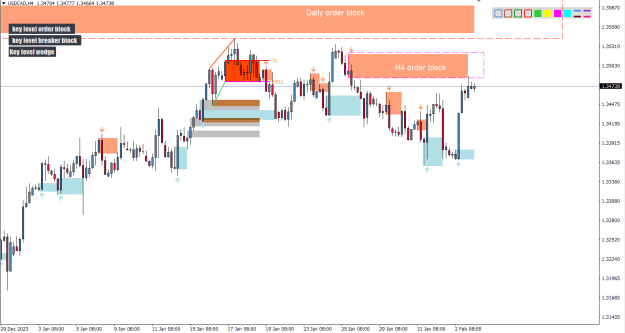
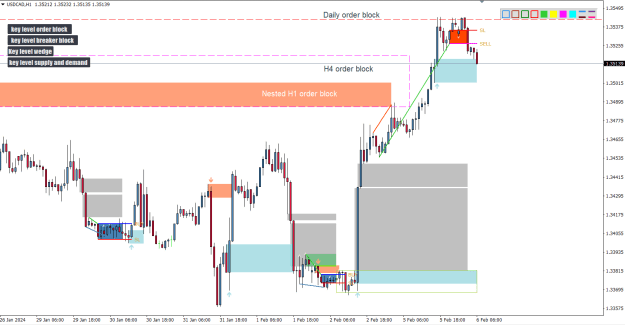
- on the 2nd pic below, price just touched a fresh H4 order block which will act as our resistance.
Attached Image (click to enlarge)
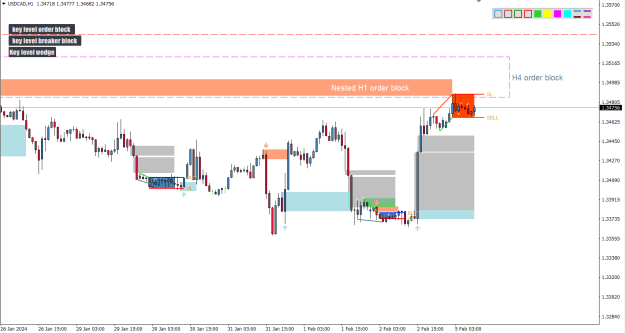
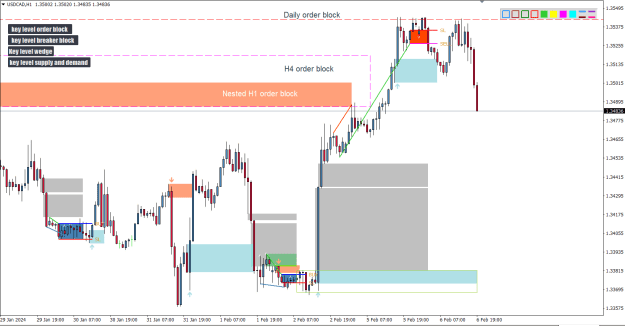
- on the 3rd pic below, we have our wedge pattern, and it also just touched an H1 orderblock nested inside our H4 orderblock adding more resistance.
Attached Image (click to enlarge)
the imbalance is perfect acting as our target, the only thing im not so happy about is our sell and stoploss should be at least twice the distance from our imbalance.
so for an aggressive trade you can enter on the sell, for a conservative trade, you can wait for it to be atleast twice the distance.
Dont forget to watch the wedge video on the youtube channel to see the perfect conditions for a wedge entry.
Potential Bearish Wedge trade on UsdCad H1 drawn by the key level wedge indicator - on the 1st pic below its the daily chart we see theres a fresh order block which is not mitigated yet. so theres a chance price might want to touch there first. {image} - on the 2nd pic below, price just touched a fresh H4 order block which will act as our resistance. {image} - on the 3rd pic below, we have our wedge pattern, and it also just touched an H1 orderblock nested inside...
Ignored
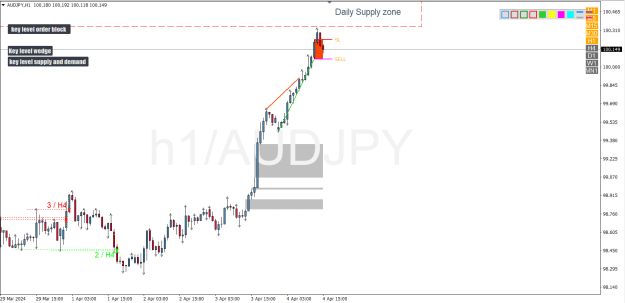
-and like we mentioned earlier that price may want to mitigate the daily order block first, thats what happened. Price has rushed up to touch it.
Attached Image (click to enlarge)
- and on our 2nd pic its our wedge pattern. as long as price hasnt touched the sell line it continues to re-adjust itself, and now it has a 2r distance to the imbalance we wanted at the beginning. SL might be a bit tight but it has met all the conditions so we wait and see if price returns.
this goes to show the importance of a "confirmation entry".
some people would have blindly entered on the H1/H4 order block, but waiting for the wedge pattern as a confirmation to enter has saved from what would be a bad trade.
{quote} -and like we mentioned earlier that price may want to mitigate the daily order block first, thats what happened. Price has rushed up to touch it. {image} - and on our 2nd pic its our wedge pattern. as long as price hasnt touched the sell line it continues to re-adjust itself, and now it has a 2r distance to the imbalance we wanted at the beginning. SL might be a bit tight but it has met all the conditions so we wait and see if price returns. this goes to show the importance of a "confirmation entry". some people would have blindly entered...
Ignored
finally got a break on the sell of our wedge pattern
Attached Image (click to enlarge)
stoploss was too tight =') as mentioned earlier, best place was on the high
but move played out well
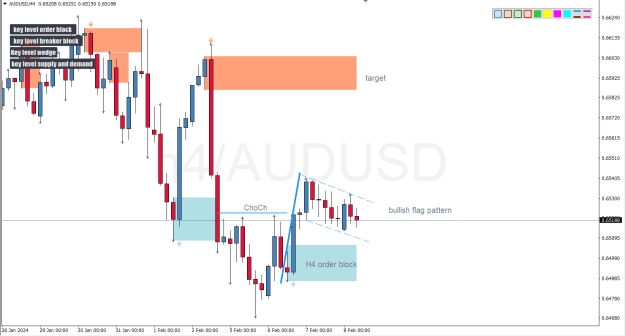
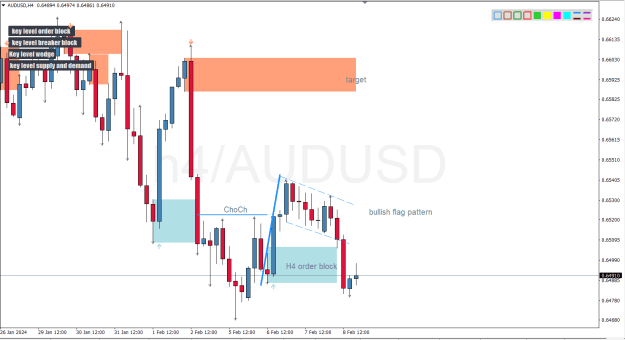
Potential buy setup on AudUsd H4
so the key level order block just drew an H4 order block which just broke the last Low-highs (LH) of a down trend, turning them into a Change of Character (ChoCh) which signals a change of trend.
Attached Image (click to enlarge)
- Theres also a formation of a bullish flag pattern forming, adding more to our bullish bias.
- And the large imbalance aswell in between which will draw price adding more to the bullsih bias.
so what we are waiting for now is for price to pullback and touch(mitigate) the order block below, and then we enter a buy trade on the break of the flag channel.
a more risky/aggressive is to enter a buy trade soon as price breaks the bullish flag.
Potential buy setup on AudUsd H4 so the key level order block just drew an H4 order block which just broke the last Low-highs (LH) of a down trend, turning them into a Change of Character (ChoCh) which signals a change of trend. {image} - Theres also a formation of a bullish flag pattern forming, adding more to our bullish bias. - And the large imbalance aswell in between which will draw price adding more to the bullsih bias. so what we are waiting for now is for...
Ignored
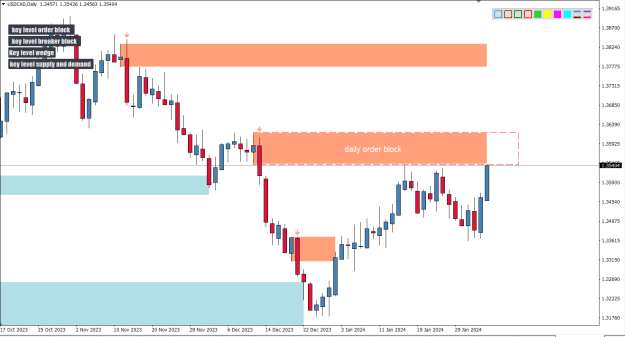
update: because the order block did not hold it invalidates our setup and we dont take the trade on the bullish flag pattern.
Attached Image (click to enlarge)
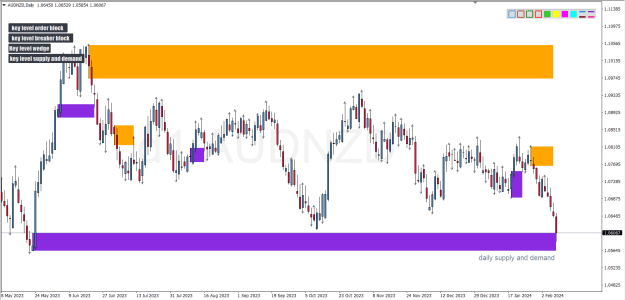
another example of why its important not to take trades blindly on zone but wait for a confirmation pattern to sieve out the bad ones.
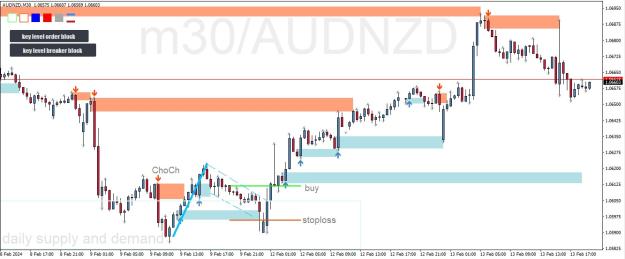
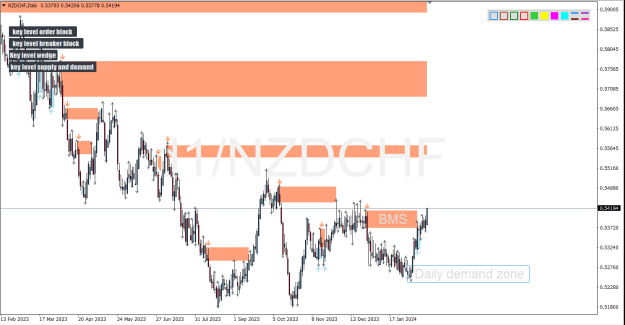
so on the pic below, we have price hitting a demand zone on the Daily chart of AudNzd created by the key level supply and demand .
Attached Image (click to enlarge)
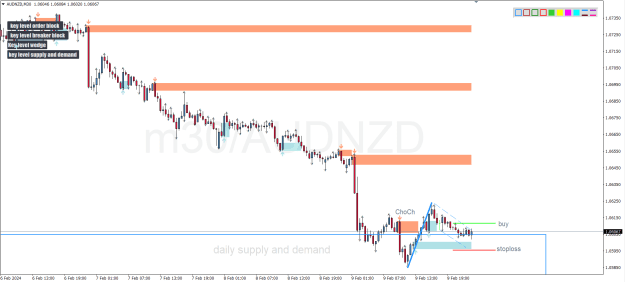
dropping down to lower timeframe on the second pic on the m30 chart, soon as price touched the daily demand zone, it went up, breaking the last order block which created the last low, signaling a change in trend.
Attached Image (click to enlarge)
A bullish pattern formed aswell as a confirmation entry, so we will be anticipating a buy setup soon as it breaks the buy line.
Potential buy setup on AudNzd m30 so on the pic below, we have price hitting a demand zone on the Daily chart of AudNzd created by the key level supply and demand . {image} dropping down to lower timeframe on the second pic on the m30 chart, soon as price touched the daily demand zone, it went up, breaking the last order block which created the last low, signaling a change in trend. {image} A bullish pattern formed aswell as a confirmation entry, so we will be anticipating...
Ignored
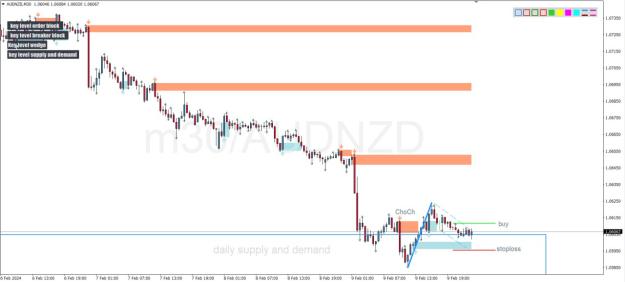
the before and after of our Audnzd m30 buy setup.
before
Attached Image (click to enlarge)
after
Attached Image (click to enlarge)
on the after, the market opened gapping down just to mitigate the order block below, then price proceded to go up and cross our buy line , triggering our buy setup from our bullish flag pattern confirmation entry and continued heading up.
notice how price respects and always reacts when it touches the order blocks created by the key level order block
they are good zones to take off profit.
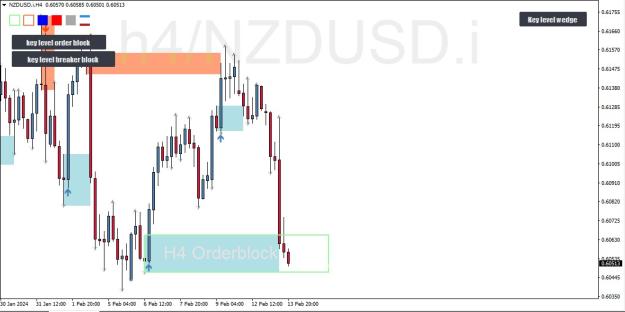
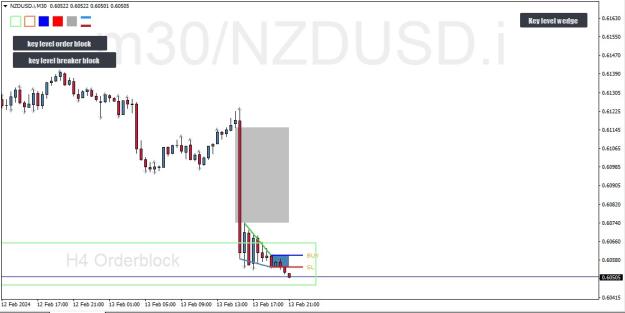
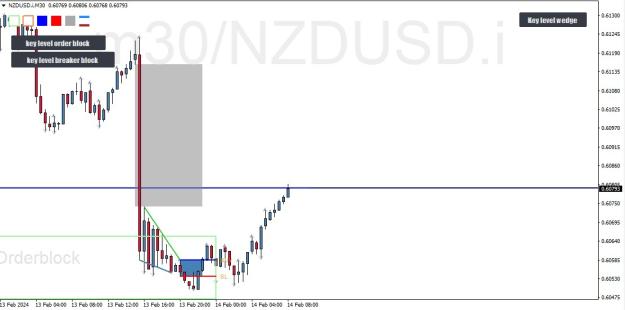
Potential bullish wedge pattern on m30 NzdUsd pic1 below= price has hit a fresh h4 order block acting as a support zone. {image} pic2 below= a bullish wedge pattern is formed. {image} what we want is price not to go below the h4 orderblock before it hits our buy line. and from experience SL should go on the low.
Ignored
the before and after of our NzdUsd m30 Bullish wedge pattern
- on pic 1 below, price finally touched the buy line triggering our buy setup, and as mentioned earlier, the stoploss line is too tight, so we set our stoploss on the last low created. Before
Attached Image (click to enlarge)
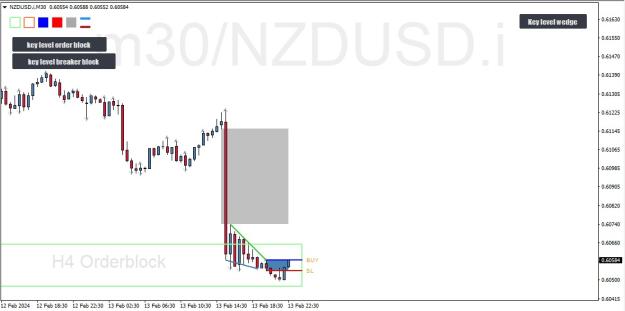
- on pic 2 below, price retraced abit, did not hit our low, and then rushed back up to hit our first target the imbalance above. After
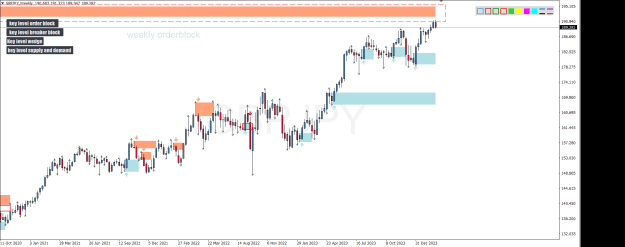
here are high probability HTF zones to look for a confirmation entry on this week {image} {image}
Ignored
Price eventually touched our weekly zone
Attached Image (click to enlarge)
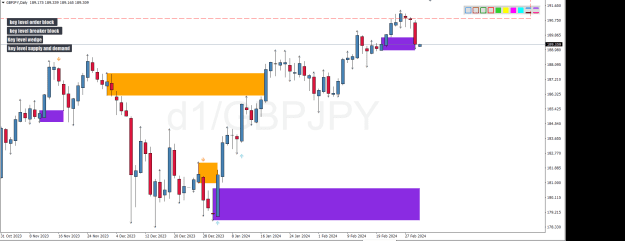
if we drop down on the Daily timeframe we see it pulled back, and has currently hit a Daily demand zone.
if it breaks through this demand zone then it will indicate a change in trend
Attached Image (click to enlarge)
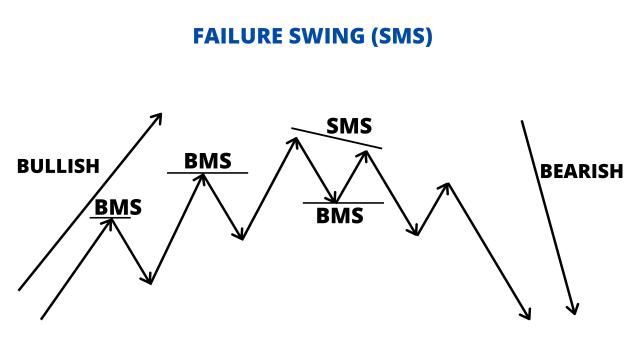
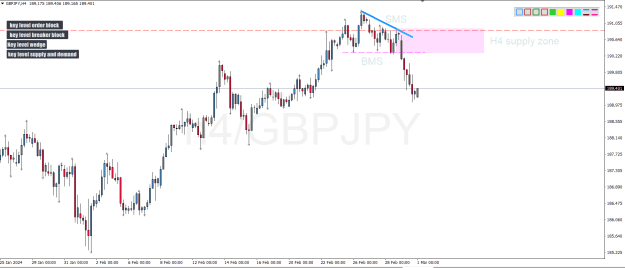
and on H4 we have a confirmation pattern which has formed in the form of a Failure swing (SMS) pattern.
so for a conservative entry, if price breaks the Daily demand zone, then we can look for our entry on this failure swing.
but for a risky entry, you can enter the zone when price pulls back without breaking the daily demand zone
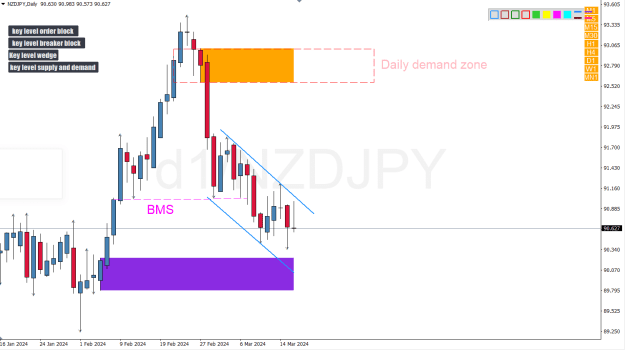
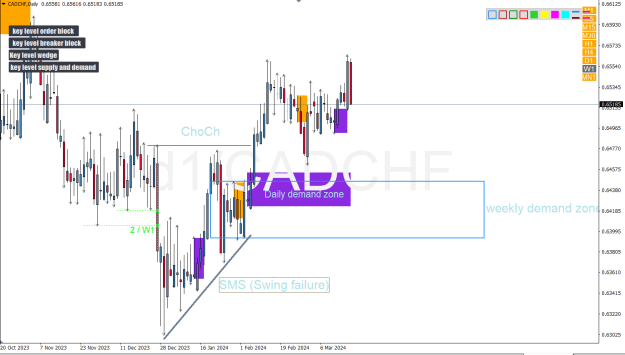
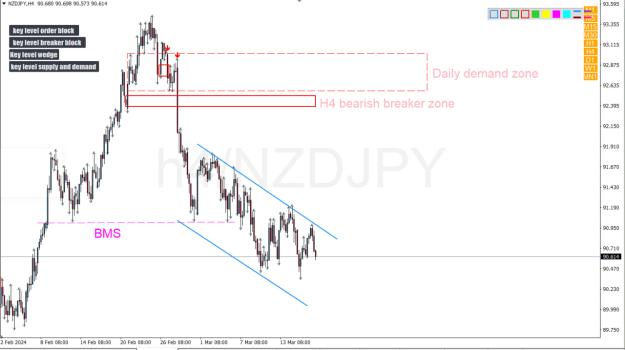
We have a potential sell setup on Nzdjpy Daily timeframe pic1 - Daily demand zone broke structure below indicating a change in trend for a bearish move.
So we will be waiting for price to come back and mitigate it.
Attached Image (click to enlarge)
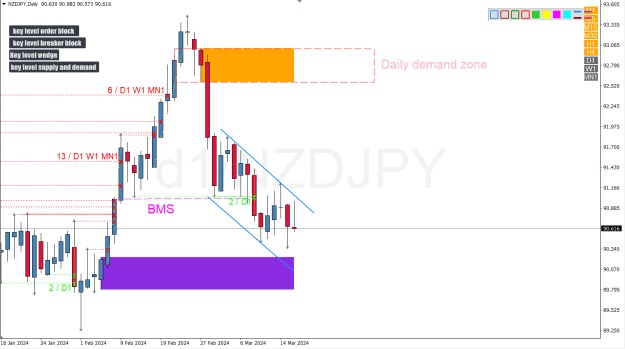
pic2 - Pressing the higher timeframes buttons on the Key level liquidity grab its showing us the move grabbed liquidity for Daily, Weekly and Monthly highs , adding more confluence to our setup.
Attached Image (click to enlarge)
dropping down to H4 timeframe, we see there's an H4 breaker block right below our Daily demand zone,
So we should include it in the area of Sell
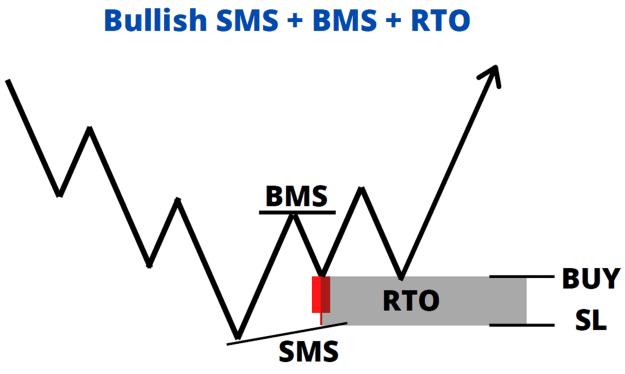
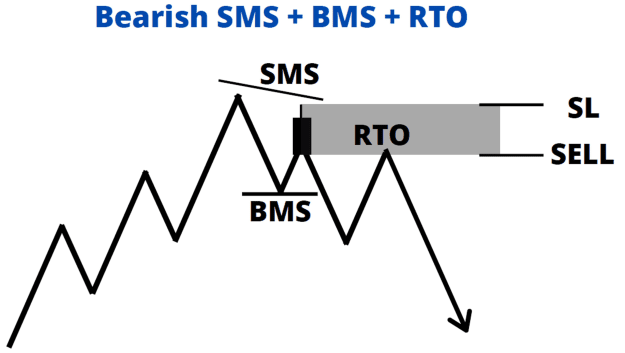
Pic 1- Is a schematic of a SMS (Swing failure) pattern, where price makes a reversal and fails to break the previous low, and we look to take a trade on the point of interest (order block/demand zone) which broke the structure.
Attached Image (click to enlarge)
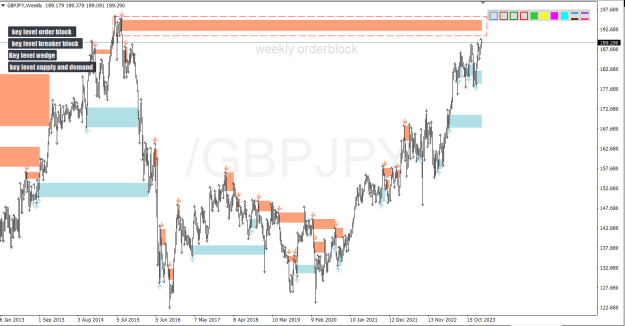
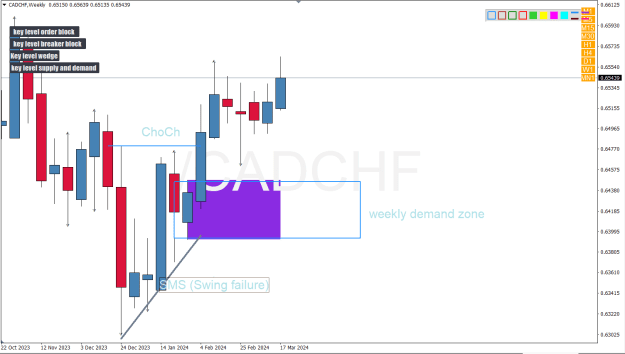
Pic 2- is a picture of the weekly time frame. The purple zone is the key level supply and demand indicator which shows us a demand zone breaking structure.
Attached Image (click to enlarge)
Pic 3 - Is the daily timeframe showing us a refined nested daily demand zone inside the weekly demand zone which also broke structure, and there is additional confluence of the key level liquidity grab showing weekly timeframe liquidity was grabbed.
Attached Image (click to enlarge)
so we will be anticipating price to come back and mitigate the demand zones then head back up.
We have a potential sell setup on Nzdjpy Daily timeframe pic1 - Daily demand zone broke structure below indicating a change in trend for a bearish move. So we will be waiting for price to come back and mitigate it. {image} pic2 - Pressing the higher timeframes buttons on the Key level liquidity grab its showing us the move grabbed liquidity for Daily, Weekly and Monthly highs , adding more confluence to our setup. {image} dropping down to H4 timeframe, we see there's an H4 breaker block right below our Daily demand zone, So we should include it...
Ignored
Attached Image (click to enlarge)
Attached Image (click to enlarge)
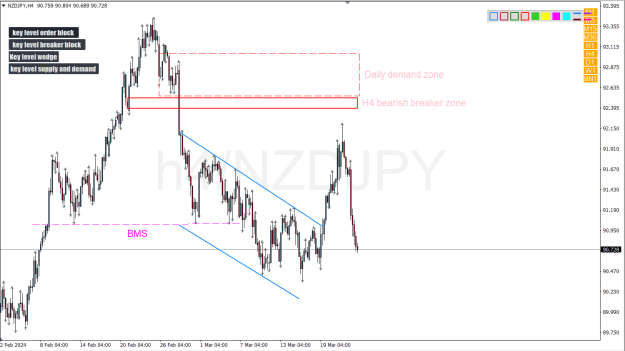
looking at the Nzdjpy H4 sell setup we posted earlier, Price was a whisker away from our sell area
it wicked the imbalance which was below, so now we know next time to include it.
lets look for another setup.
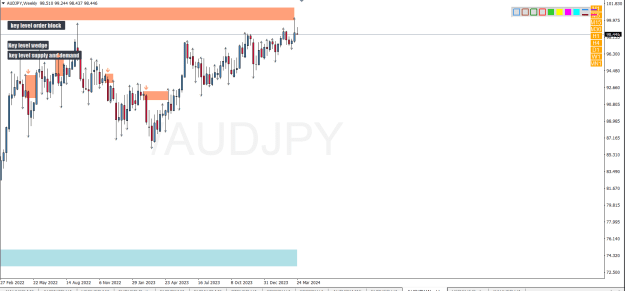
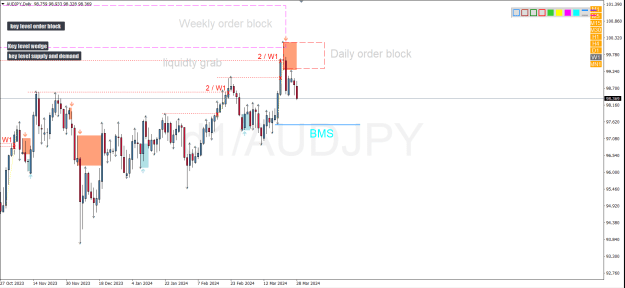
Theres a Potential Sell Setup on the AudJpy H4 timeframe: Pic 1: (weekly timeframe) Price just wicked the weekly orderblock.
Attached Image (click to enlarge)
Pic2: Is showing how alot of liquidity was created on the way to the weekly order block, increasing our odds for price going down to mitigate the liquidity.
Attached Image (click to enlarge)
Pic3: (daily timeframe) the weekly order block is acting like a resistance zone price bouncing off it, and we see how the move was also a liquidity grab, adding to our sell confluences. An order block was created on our reversal and if price breaks the structure marked in blue below, it will confirm a change in trend, and we will be looking to take a sell setup on the daily order block, and for a more refined entry with a bigger risk reward, we will look for a confirmation entry on lower timeframes.
Attached Image (click to enlarge)
Pic 4: (H4 timeframe) dropping down to H4 we see a more refined order block. But from previous experience we know to increase the zone and include FVG/Imbalance also.
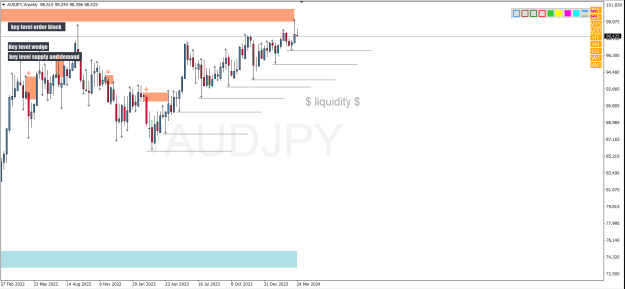
Like most xxx-Yuan trades like our previous setup, here there's a potential Sell Setup on H1 UsdJpy. I will break down how i use all my Key level indicators together to see potential trades.
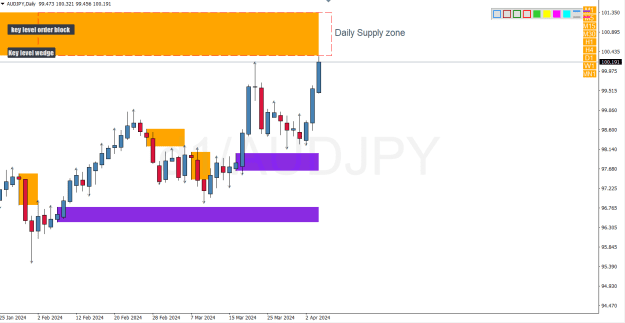
Pic 1: ( weekly timeframe) Price always respects structure on Higher time more than lower time frame, So we start our analysis on the weekly timeframe.
Here we see price has bumped a top for the third time, creating a sell biased resistance zone called the Triple top, so we now focus on sell setups only on lower timeframes.
Attached Image (click to enlarge)
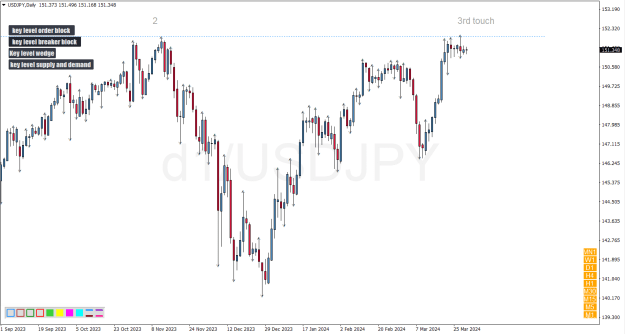
Pic 2: (daily timeframe) Here we zoom in more to see the 3rd touch.
Attached Image (click to enlarge)
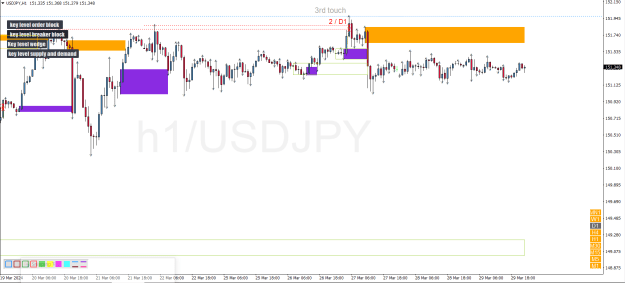
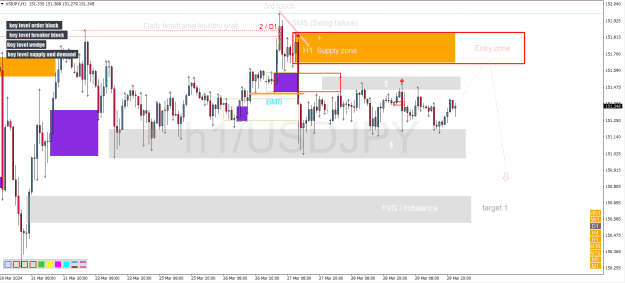
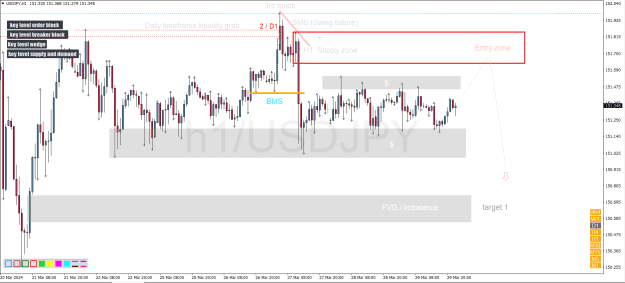
Pic 3: (H1 timeframe) With every switch of timeframe, we put the indicators on the chart to see if there is any pattern sticking out.
Attached Image (click to enlarge)
Pic 4: ( schematic) This is a random picture i found on the internet of an SMS (swing failure) schematic, and looks identical to what is building up on the H1 timeframe, so we proceed to add the rest of the indicators for extra confluence and more information to give us a sell bias.
Attached Image (click to enlarge)
Pic 5: (details)
a. Liquidity grab – usually when banks want to cause a reversal, the cant just dump money, they need orders. You’ve got to understand, in order for the market to change direction a huge amount of orders are needed, so one of the money ways the find their orders is via false breakouts and areas like highs/lows where a lot of stoploss orders are placed.
So the Key level liquidity grab plays an important role by acting as a very good confluence by showing us areas where liquidity was grabbed indicating a potential change in direction, and we labeled it there in the pic.
b. 3rd touch - After the liquidity was grabbed, we see price made the 3rd touch on the resistance and it fell down
c. SMS(swing failure) – after price fell down, it failed to break the previous high it had created, hence the term swing failure.
d. H1 supply zone – the Key level supply and demand indicator drew a supply zone, and that supply zone broke the last structure which had created the high, meaning a lot of orders were required to break a previously strong structure, so we expect price to come and mitigate our supply zone before it goes back down. So this will be our Entry zone.
e. BMS – Theres a reason why we chose this as the BMS or the correct term ChoCH (Change of character). The reason is we placed the Key level breaker block indicator which drew the breaker block (the red zone below the supply zone), and the breaker block is basically a failed order block, so it’s showing us the last order block which created that last high, that was then broken by the supply zone we marked earlier. And the best breaker blocks are the one that grab liquidity first as shown in the pic, and notice how price has respected the breaker block zone and failed multiple times to break above its zone (first area marked by grey)
f. $ - The grey zones with the $ represent areas where price got congested and these are usually filled with orders/liquidity.
g. FVG/Imbalance – and we made the FVG/imbalance as our first target because they usually act like support and resistance levels.
Attached Image (click to enlarge)
Pic 6: (The final picture) After labeling everything we clear the indicators by pressing the buttons so that we have a clear and clean chart and let the market play out.
Attached Image (click to enlarge)
N.B = But as good as everything sounds, things might go wrong and we get stopped out.
As a contingency, we’ll look for a second trade only when there is a liquidity grab on the triple top. There are a lot of orders there and it will make a good high probability trade.
Very good video on how to use a Liquidty grab to create a Quasimodo pattern, Support and resistance zones aswell as a way to exit profitable trades early. Key level liquidty grab