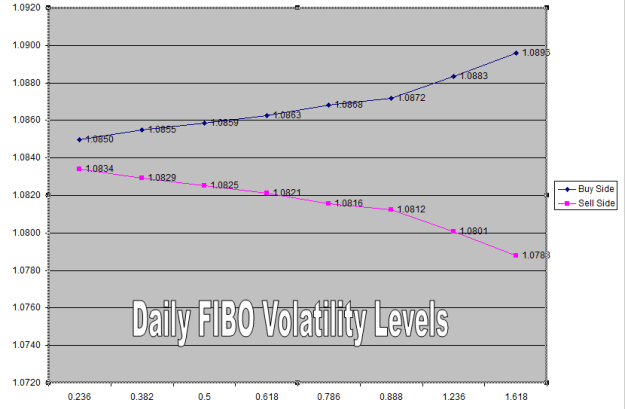
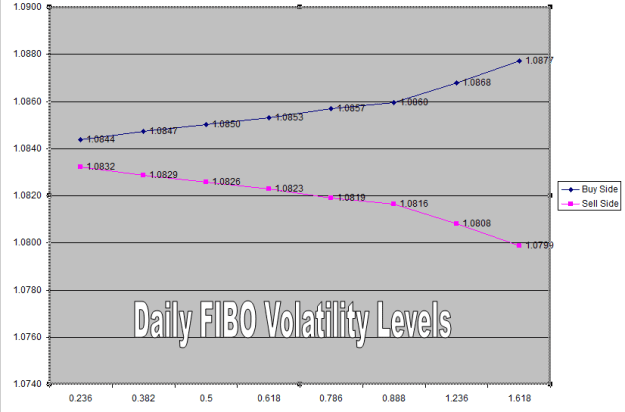
{quote} Projection line is going down so i only picked Sell Stop order. I opened two positions with Sell Stop @ 1.0834 which is my 0.236 level. One position hit TP1 0.382 (1.0829) and TP2 0.5(1.0825). Second position is running with SL at BE.
Ignored
As i mention that projection line of jnevins is going down so i have to stick with pink line. Second position is running with SL at BE. My confirm final target is 1.236 (1.0801) and extended target is 1.618(1.0788)
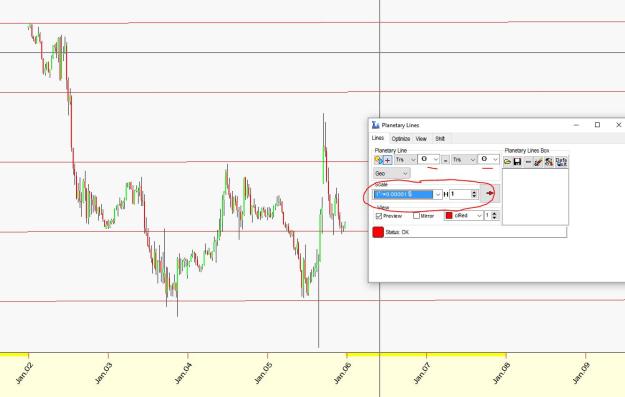
Sorry Jnevins, I have problem to draw planetary lines on lower time frames in real time. 1) If I have daily real time it is ok(first image), I have right planetary lines and I know that they are right because I compare them with other software 2) if I have for example 1H, TIMINGSOLUTIONS tells me that there are too many lines if I put 0.1$ for scale and 4harmonics the software does not allow me to write little scale for intraday charts thank's in advance {image} {image}
Ignored
Multiply the value by .00001 and put the harmonics back to 1
{quote} As i mention that projection line of jnevins is going down so i have to stick with pink line. Second position is running with SL at BE. My confirm final target is 1.236 (1.0801) and extended target is 1.618(1.0788) {image}
Ignored
Wonderful Aahmad. We did have a nice down move overnight to 1.08000 Your system takes my directional inclinations and makes it tangible and tradable. Working together everyone, we might make some real progress.
This week we have: Bisextile - Venus-Saturn-Jupiter Mars-Mercury - still in conjunction Moon-Neptune - opposition I did some TS plotting on Demo. Jerry, could you please plot what you think it's significant of the above on Astronomy module. Thank you! {image} {image}
Ignored
What jumps out to me is Sun Square Jupiter and Mars Conj Mercury.
This week we have: Bisextile - Venus-Saturn-Jupiter Mars-Mercury - still in conjunction Moon-Neptune - opposition I did some TS plotting on Demo. Jerry, could you please plot what you think it's significant of the above on Astronomy module. Thank you! {image} {image}
Ignored
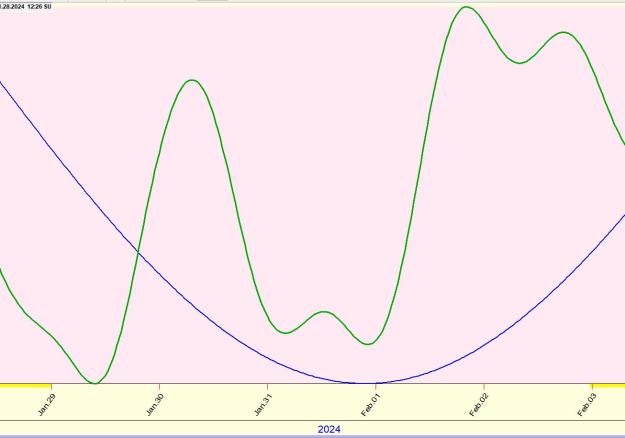
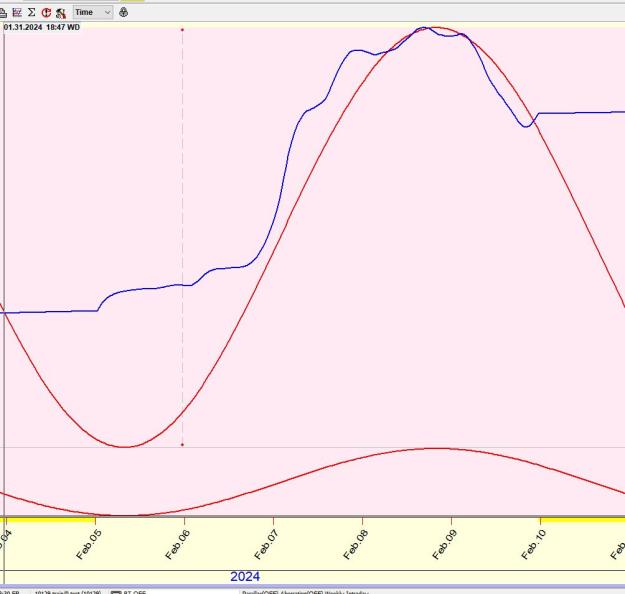
Hi Ultras... Here is a Mars Merc plot that is smoothed out using Geo 1h and 100% smooth orb (Blue Line) The green line is a manual cucle of 13.99 days as found in the Spectrum module.
{quote} Hi Ultras... Here is a Mars Merc plot that is smoothed out using Geo 1h and 100% smooth orb (Blue Line) The green line is a manual cucle of 13.99 days as found in the Spectrum module. {image}
Ignored
According to this projection line , I will pick Sell line because projection line is going down on Jan 30 after going up little bit. I only pick daily chart and we have support at 1.0730 area
Joined Aug 2012
|
Status: Love for all; Hatred for none
|3,495 Posts
Buy Zone start with 0.236 at 1.0836 and Sell Zone start with 0.236 at 1.0824. There may be little up move as per jnevins projection line and then moving down. For good probability, we must stick with down move but if we take risk then move SL to BE at .382 level and close the Buy position at 0.5 level.
{quote} Multiply the value by .00001 and put the harmonics back to 1 i.e., Scale 1° = 0.00001$, H1 {image}
Ignored
Thank you for your replay
EURUSD 1H:
if I put 0.1 and Harmonic 1...status: OK
if I put 0.01 and Harmonic 1...status: too many lines....there are not planetary lines on chart
as I wrote: I can't write little scale such as 0.0001.....too many lines and software does not plot lines I can only with time frame D1
Buy Zone start with 0.236 at 1.0836 and Sell Zone start with 0.236 at 1.0824. There may be little up move as per jnevins projection line and then moving down. For good probability, we must stick with down move but if we take risk then move SL to BE at .382 level and close the Buy position at 0.5 level. https://youtu.be/220XBKLGo0M
Ignored
My strategy
Both pending orders triggered.
Buy Stop order triggered and hit TP1. SL was moved to BE and price did not hit TP2 and SL was hit at BE
Sell Stop order triggered and hit both TP1 and TP2.
Price went down but now quickly moving up which is against projection line. Lets see what happen in NY session
{quote} Hi Ultras... Here is a Mars Merc plot that is smoothed out using Geo 1h and 100% smooth orb (Blue Line) The green line is a manual cucle of 13.99 days as found in the Spectrum module. {image}
Ignored
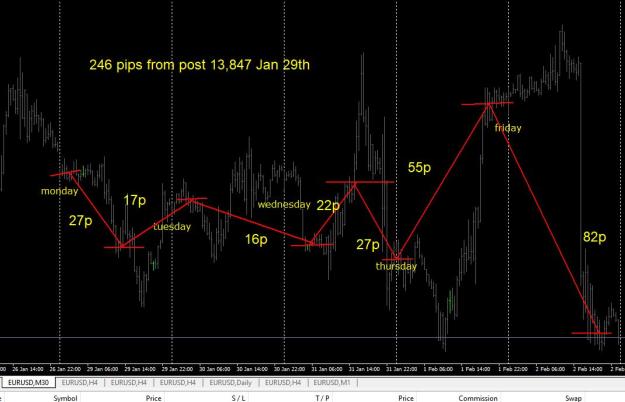
Price moved according to projection line. First it went down and then up. But as i mentioned that down slope of projection line is big slope so will stay with Sell Side.
I forgot to post here but i always post in EURUSD thread. Here is my sell line started with 1.0832 and price went to my final target 1.236(1808).
Now from today i will ignore down and will stay with up move according to projection line. As per projection line, price is moving sideways (little up and down) and then strong up move but red folders are coming so up move can start earlier so only Buy stop will be considered. Lets see what happen in NY session
{quote} Price moved according to projection line. First it went down and then up. But as i mentioned that down slope of projection line is big slope so will stay with Sell Side. I forgot to post here but i always post in EURUSD thread. Here is my sell line started with 1.0832 and price went to my final target 1.236(1808). Now from today i will ignore down and will stay with up move according to projection line. As per projection line, price is moving sideways (little up and down) and then strong up move but red folders are coming so up move can...
Ignored
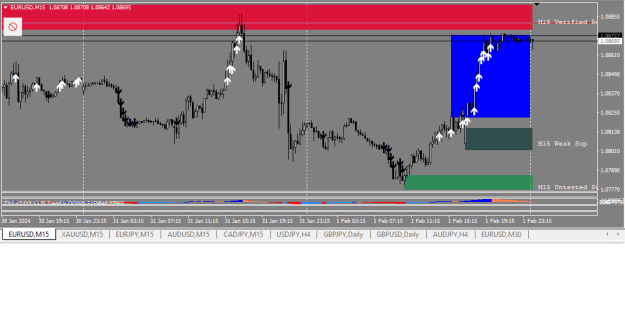
As per plan according to projection slope of jnevins , i stayed with Buy stop order. Blue rectangle area is my buy stop triggered and range.
{quote} Thank you for your replay EURUSD 1H: if I put 0.1 and Harmonic 1...status: OK if I put 0.01 and Harmonic 1...status: too many lines....there are not planetary lines on chart as I wrote: I can't write little scale such as 0.0001.....too many lines and software does not plot lines I can only with time frame D1 {image} {image}
Ignored
What version of TS do you have? What is its release date?
{quote} Hi Ultras... Here is a Mars Merc plot that is smoothed out using Geo 1h and 100% smooth orb (Blue Line) The green line is a manual cucle of 13.99 days as found in the Spectrum module. {image}
Ignored
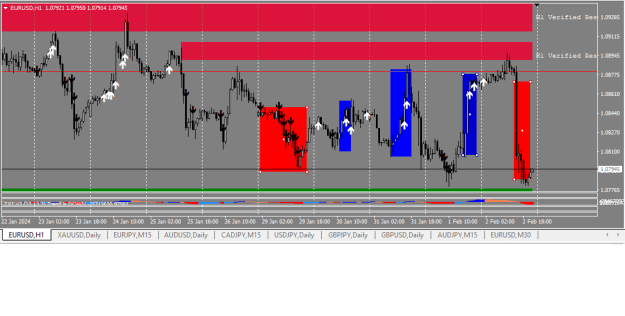
I was trying to reduce DD and it worked. My buy stop and sell stop orders based on volatility had minimal DD. Blue and red rectangles are for Buy stop and sell stop simultaneously.
Here is the result of this week.
Remember i used sell stop for only down slope of projection line and Buy stop for up slope.
Sergey has been developing an improved Intermarket module for Timing Solution Software as well as big improvements to the TS Mobile platform. How can we find the best leading indicator for EURUSD as a predictive instrument?