check this out. it's nothing really but art by ensign software. i'm looking for a good charting package that will allow overlay of futures on forex. so i need futures data feed and forex.
i hate esignal.
well this is the real deal. it's exactly what i have been talking about. it's a real representation of the market in 3d. candles widen to show volume and become more contrasting as well to really show which candles mean anything at all. the skinny dark candles are noise during quiet markets that we don't trade. thank you, CQG. this is it and it's for futures.
well this is the real deal. it's exactly what i have been talking about. it's a real representation of the market in 3d. candles widen to show volume and become more contrasting as well to really show which candles mean anything at all. the skinny dark candles are noise during quiet markets that we don't trade. thank you, CQG. this is it and it's for futures.
Ignored
Ok, so I have to ask... is anyone going to convert this cool idea for Spot markets..? plz..? maybe for TradeStation or MT4...??
|
Commercial Member
|
Joined May 2007
|7,612 Posts
There is a HUGE problem with all of this.
99% of us use retail forex brokers.
And they all pad the spread, and they all have different volumes.
(Just open up a couple of different brokers at the same time and look at prices, you will see what i mean.)
Volume can only be measured on YOUR server. Thats it.
The Interbank feed is something we will probably never be able to see for real. Even an ECN broker doesn't show what the banks are really asking of each other.
The reality is, we are playing in a market where the "market" action we see is distorted, and in some case flat out fabricated. So knowing this, how is it possible to create a reliable third variable. Time doesn't exist. I agree with that point, so it doesn't matter. (Some servers are on GMT, while others aren't - so you will have different candles. On one you may have the mother of all hammers, on the other it might be a different story all together.)
Until this is centralized, and that is possible to an extent, ala CME/Reuters later this year...this is an impossible dream. I really wish it weren't, but the fact is, we are playing in an unregulated market. The reason Visual Trader works is because it is coming from a central point.
In theory you could even get this to work on your server, say Interbank FX....but what happens when the real market jumps up suddenly due to some psycho at UBS buying 500 billion EUR/USD? Interbank has to hedge themselves, and your server becomes the feeding ground.
Or something like that.
Ignored
Maybe a system (neural, Cart system, etc.) that can plug in multiple feeds fed as inputs into a network that kicks out one price (output)???
You're making it too difficult.
Where do you see a central market place for GBPUSD? I'll tell you; CME. Quit bickering this point. CME is real central marketplace. Get the data feed and tell me it's not. Now I've made this point before; IBFX volumes are very similar to CME. Granted they might be only tick data but they are very close/ similar to CME volumes. IBFX does not just show ticks from their platform or you would not see a tick update late afternoon for like 1 minute+ at a time. Their ticks come through similar to CME therefore without calling Javier to verify I can deduce they are buying a data feed from a third party provider. This particular third party provider is no doubt a blend of banks. Very commonly EBS is the feed that is purchased to show real market on forex. You can create agreements with your retail broker to not execute anything unless it deals on EBS prices therefore they cannot spike you out. I'm not going to expound on this front anymore. I apologize for the bluntness of my points, but I've heard enough from people assuming and speculating in their bedrooms at home via their computers. [sigh]
If you are interested in CQG charting you can get demo access for two weeks.
Email Melody here: [email protected]
Provide your name and address and phone number.
You will get access to Forex, CME, Globex, CBOT data.
Why do we need CBOT and CME and even Globex????
Well we are forex traders and we are not the only fish in the sea. The most liquid instrument in the world is the 10 year note. You say [in whining voice] "Na, eh...Forex is 3 trillion a day largest market in the world."
BS you easily fooled inexperienced newb. I was once in your shoes and believed everything brokers told me.
The 10 year note trades on CBOT exchange and is the most liquid contract in the world. It trades in one day what your GBPUSD trades in one month. No joke. Gold also trades on CBOT and Gold is a great indicator of Forex movement. Gold typically moves in very well defined waves. Look at a 23 tick chart.
[Back on track] the ZN determines the USD strength via rate expectation. If rates are expected to rise we see 10 year yeilds rising. Vice versa we see prices for 10 year notes declining. It's an inverse relationship based on a discount to purchase the notes. Don't ask. So we see prices declining which means yeild is increasing and USD in effect is increasing in strength therefore we see GBPUSD going south as USD outstrips GBP sterling. The beauty of forex is we see major volatility. GBPUSD spikes up and down while the ZN trends very smoothly down. We get short on a spike up of GBPUSD while ZN is trending down and we improve our chances of profitable trades.
So why do we need Globex and CME data? The S&P trades on CME and DJ EURO STOXX trades on Globex. These paritcular equites are correlated to forex as well. If S&P is trending down we commonly see GBPUSD trending the same direction. More so we look to these equities to show Carry trade sentiment. So if we see S&P as well as EURO STOXX moving up we can expect carry trades are doing well today.
Where does CQG come in? Well CQG provides charting data for all the instruments we want to see. Not only does it show price action but it combines price with aggression of the market. How strong is the trend really? We see through CQG the strength with which players are hitting the bid or offer and it is interpretted on the chart by brightness, width and height of candles.
You can imagine how excited I am if you scroll back a month ago on this thread and see that I've provided an image of what I want in a charting package and it's exactly what CQG has created. What a coincidence! Either CQG and I are really stupid and on the same stupid wave length or we each understand market dynamics just a little. Enough to get our asses kicked in a bar fight I'm sure.
If you want the CQG demo feed I've talked to Melody and she is awaiting our emails for setup of the application. I receive no compensation for any of this.
If you are interested in learning more about how to trade carry trades with equites as an indicator and understand more about ZN leading forex movements email NewstraderFX on Forex Factory. He is a FFAN analyst and posts nearly every day on the News and Analysis section. If I've pissed anyone off with this thread please IM me. I'm sure I'll care.
Until this is centralized, and that is possible to an extent, ala CME/Reuters later this year...this is an impossible dream.
Ignored
Considering that the CME has just revised merger talks with the CBOT for the sixth time in the past two years, something tells me that a global FX centralization through CME ain't going to happen any time soon. :
And as FxFORCE pointed out, why not just use/compare the volume data on USD currency pair futures that are already listed on the CME?
Hi all. I've studied 3D animation for more than 10 years and have been trading off an on for approximately 7 years. This is a subject that I've thought of quite a bit and when you blend the two activities I mentioned earlier, then you come up with some interesting possibilities.
3D charting is actually something I'm doing sim research on right now. Although for my prototype I didn't use the charts at all, and that's by design.
Personally, I think trading could be a lot more engaging. The experience of making a trade should be much closer to the excitement of playing a good game.
Below is a screenshot of an early alpha prototype which displays two characters face to face. I'm working on the bull and the bear models These two characters represent the Longs and the Shorts of the market. When you place your trade you are with that side until you close your trade. In the mean time and inbetween time you are engaged in combat. Going forward and backwards instead of up and down. I have this app at a very early stage but ultimately the goal is to build a different type of trading experience.
You're making it too difficult.
Where do you see a central market place for GBPUSD? I'll tell you; CME. Quit bickering this point. CME is real central marketplace. Get the data feed and tell me it's not. Now I've made this point before; IBFX volumes are very similar to CME. Granted they might be only tick data but they are very close/ similar to CME volumes. IBFX does not just show ticks from their platform or you would not see a tick update late afternoon for like 1 minute+ at a time. Their ticks come through similar to CME therefore without calling Javier to verify I can deduce they are buying a data feed from a third party provider. This particular third party provider is no doubt a blend of banks. Very commonly EBS is the feed that is purchased to show real market on forex. You can create agreements with your retail broker to not execute anything unless it deals on EBS prices therefore they cannot spike you out. I'm not going to expound on this front anymore. I apologize for the bluntness of my points, but I've heard enough from people assuming and speculating in their bedrooms at home via their computers. [sigh]
If you are interested in CQG charting you can get demo access for two weeks.
Email Melody here: [email protected]
Provide your name and address and phone number.
You will get access to Forex, CME, Globex, CBOT data.
Why do we need CBOT and CME and even Globex????
Well we are forex traders and we are not the only fish in the sea. The most liquid instrument in the world is the 10 year note. You say [in whining voice] "Na, eh...Forex is 3 trillion a day largest market in the world."
BS you easily fooled inexperienced newb. I was once in your shoes and believed everything brokers told me.
The 10 year note trades on CBOT exchange and is the most liquid contract in the world. It trades in one day what your GBPUSD trades in one month. No joke. Gold also trades on CBOT and Gold is a great indicator of Forex movement. Gold typically moves in very well defined waves. Look at a 23 tick chart.
[Back on track] the ZN determines the USD strength via rate expectation. If rates are expected to rise we see 10 year yeilds rising. Vice versa we see prices for 10 year notes declining. It's an inverse relationship based on a discount to purchase the notes. Don't ask. So we see prices declining which means yeild is increasing and USD in effect is increasing in strength therefore we see GBPUSD going south as USD outstrips GBP sterling. The beauty of forex is we see major volatility. GBPUSD spikes up and down while the ZN trends very smoothly down. We get short on a spike up of GBPUSD while ZN is trending down and we improve our chances of profitable trades.
So why do we need Globex and CME data? The S&P trades on CME and DJ EURO STOXX trades on Globex. These paritcular equites are correlated to forex as well. If S&P is trending down we commonly see GBPUSD trending the same direction. More so we look to these equities to show Carry trade sentiment. So if we see S&P as well as EURO STOXX moving up we can expect carry trades are doing well today.
Where does CQG come in? Well CQG provides charting data for all the instruments we want to see. Not only does it show price action but it combines price with aggression of the market. How strong is the trend really? We see through CQG the strength with which players are hitting the bid or offer and it is interpretted on the chart by brightness, width and height of candles.
You can imagine how excited I am if you scroll back a month ago on this thread and see that I've provided an image of what I want in a charting package and it's exactly what CQG has created. What a coincidence! Either CQG and I are really stupid and on the same stupid wave length or we each understand market dynamics just a little. Enough to get our asses kicked in a bar fight I'm sure.
If you want the CQG demo feed I've talked to Melody and she is awaiting our emails for setup of the application. I receive no compensation for any of this.
If you are interested in learning more about how to trade carry trades with equites as an indicator and understand more about ZN leading forex movements email NewstraderFX on Forex Factory. He is a FFAN analyst and posts nearly every day on the News and Analysis section. If I've pissed anyone off with this thread please IM me. I'm sure I'll care.
Ignored
I dont' mean to pick but it would be incorrect to say there is any meaninful correlation between equities and their underlying currency. THe reason for this being growth and inflation affect fixed income, fx and equities differently.
ignoring yield and just focusing on the price, solid growth from a country will usually result in lower demand for its bonds, and higher for it's currency and equities. High inflation will result in lower bond and equities prices, and a more valuable ccy. IS there a relationship between these differnet instrument spaces? Yes, but it's dependant on which pov you take. To say there is a correlation is wrong
sccz and i have talked about this before. inter market correlation exists because money flows like a river from one side of the world to the other. (there is more money in the world than can be traded.)
Correlation is the degree to which the results of two bets are related. If you accept this definition and i propose trends are similar 80% of the time between ZN and GBP then i vote correlation exists.
Correlation between equities and carry trades exists right now because JPY as the funding vehicle affects trillions of dollars in positions between the two types of markets.
i like to watch the ZN, Gold, ES, and GBP and at the end of the day if there is a trend you'll see all 4 line up. All I'm saying is we need to know where money is flowing. yes inflation releases affect instruments differently than growth releases. Emerging markets' currencies are the main driver of all this as the funding vehicle of commodities and developed country's currencies. China brought interest rates down last week with a few trades. They shook the world and the CFTC threatened to investigate position limits. As a true hedger, China has no obligation regarding position limits. Granted they could upset the market but our CFTC says true hedgers are not subject to position limits.
here is another charting software that uses volume/aggression to show sentiment. it's not as pretty but you can really see it work. http://www.marketdelta.com/kb/rssfeed.aspx
you guys talking about creating a game to interface with forex is neat but i think it's more fantasy like dragons and unicorns. i'm a trader. i like video games but i don't have time for them during market hours. if you're going to show the bear winning every time the tick goes down and the bull winning every time the tick goes up you'll essentially create a cumulative tick indicator which is useful but it's just an indicator.
Equity markets can be used as a key indicator for movement in the Forex market. As technology has enabled greater ease with respect to transportation of capital, investing in global equity markets has become far more feasible. Accordingly, a rallying equity market in any part of the world serves as an ideal opportunity for all, regardless of geographic location. The result of this has become a strong correlation between a country's equity markets and its currency: if the equity market is rising, investment dollars are coming in to seize the opportunity. Alternatively, falling equity markets will have domestic investors selling their shares of local publicly traded firms only to seize investment opportunities abroad.
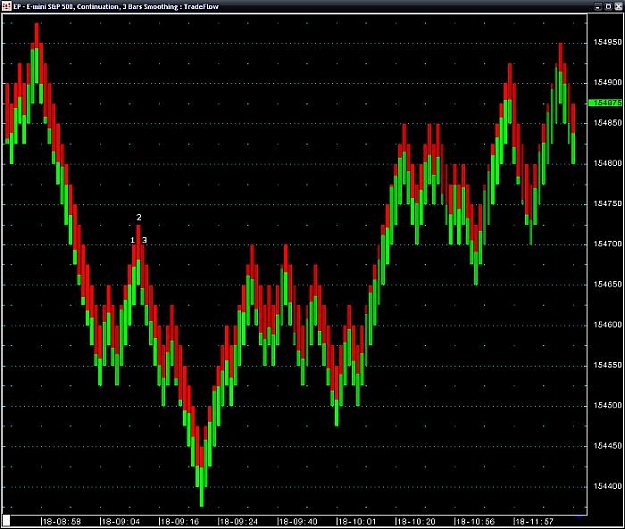
Anyone that trades price action would appreciate this image.
It's like someone wrapped up a bunch of Pin bars and gave them to us for our birthday. This is on a low compression timeframe where Pin bars are normally not reliable. As you can see on this chart they are reliable for scalping and moving stop to breakeven to take the trend.