Good morning
I'm testing your strategy, I think it's formidable, I think its main focus is: when you win you win a lot and when you lose you lose a little, this is excellent, in addition to being intuitive and visually direct.
I have a doubt, I read the input parameters in one of the posts, I wanted to know if you use any filter to choose which input has the greatest chance of winning.
Sorry for my English, it's not my first language
Good morning I'm testing your strategy, I think it's formidable, I think its main focus is: when you win you win a lot and when you lose you lose a little, this is excellent, in addition to being intuitive and visually direct. I have a doubt, I read the input parameters in one of the posts, I wanted to know if you use any filter to choose which input has the greatest chance of winning. Sorry for my English, it's not my first language
If Vidvad is correct about your question, then volume is the filter. For higher volume larger bricks and vice versa. Personally I never go higher than 6 or lower than 3 on the ES.
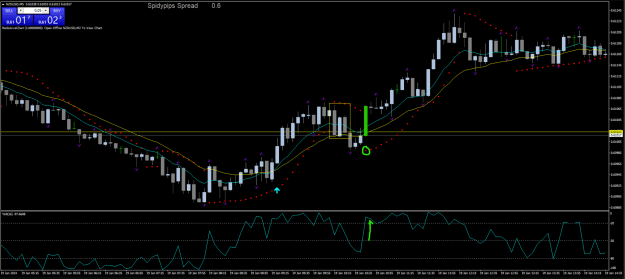
hello rockypoint, is it necessary to watch for swing highs that i marked in this chart? (rectangle)4634255 And if so, is it a valid breakout for a long position? (red line) 4634257
hello rockypoint, is it necessary to watch for swing highs that i marked in this chart? (rectangle)4634255 And if so, is it a valid breakout for a long position? (red line) 4634257
Ignored
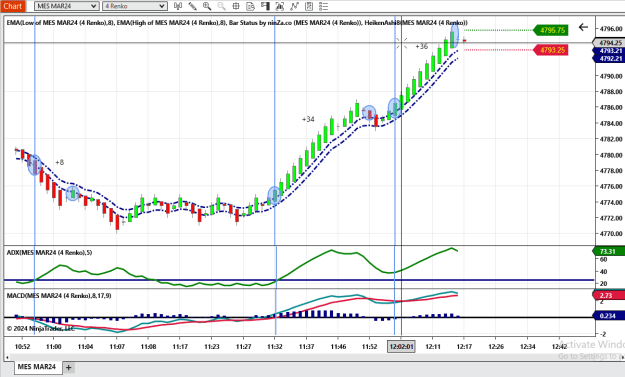
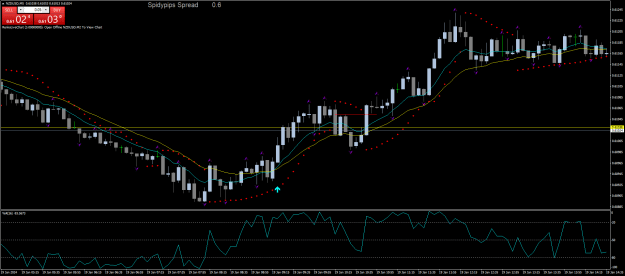
I'd think rocky would have bought when the candle I highlighted in green closed, because the PSAR did not flip, nor did the Willimas%R close above 50 until that candle first reached its high (flipping PSAR) and then closed (confirming the Williams%R close above 50.
Attached Image (click to enlarge)
My objective is to learn the skill of flawless execution of my trading plan
{quote} I'd think rocky would have bought when the candle I highlighted in green closed, because the PSAR did not flip, nor did the Willimas%R close above 50 until that candle first reached its high (flipping PSAR) and then closed (confirming the Williams%R close above 50. {image}
Ignored
hello vidvad, that the exact candle that im referring to, but im wondering if the swing high that i pointed out would make that green highlight candle valid since that green candle never closed above the highs of the previous candles
the second picture in the original post shows the breakout with the red line
{quote} hello vidvad, that the exact candle that im referring to, but im wondering if the swing high that i pointed out would make that green highlight candle valid since that green candle never closed above the highs of the previous candles the second picture in the original post shows the breakout with the red line
Ignored
i dont know what happen to that picture
Attached Image (click to enlarge)
so this is a valid breakout because of where i draw the red line?
{quote} so this is a valid breakout because of where i draw the red line?
Ignored
This is not a strict breakout strategy. Entry requires both the %R close above 50 for a long and the PSAR flip from short to red.
There is no way for me to know looking at your picture if the PSAR flipped at the level of the red line. However, even if it did, you would not KNOW for CERTAIN that the Willimas %R would be above 50 until the candle I highlighted green CLOSES.
You would BUY when that candle CLOSES.
This is NOT a breakout strategy, at least not as I read it.
My objective is to learn the skill of flawless execution of my trading plan
{quote} I'd think rocky would have bought when the candle I highlighted in green closed, because the PSAR did not flip, nor did the Willimas%R close above 50 until that candle first reached its high (flipping PSAR) and then closed (confirming the Williams%R close above 50. {image}
Ignored
im still learning more about market structure and price action and i appreciate your help. btw, do you have any GOOD!!!! price action learning material that goes into deep detail ?
{quote} This is not a strict breakout strategy. Entry requires both the %R close above 50 for a long and the PSAR flip from short to red. There is no way for me to know looking at your picture if the PSAR flipped at the level of the red line. However, even if it did, you would not KNOW for CERTAIN that the Willimas %R would be above 50 until the candle I highlighted green CLOSES. You would BUY when that candle CLOSES. This is NOT a breakout strategy, at least not as I read it.
Ignored
yes i understand but the indicators are nothing without price action itself my friend. and i do understand the method of using these indicators as confirmation to price action but im wanting to learn price as if there were no indicators
{quote} yes i understand but the indicators are nothing without price action itself my friend. and i do understand the method of using these indicators as confirmation to price action but im wanting to learn price as if there were no indicators
Ignored
thank you for your input though i would still like to hear from rockypoint as well
What Vidvad told you was correct. If you want to learn PA then use a chart without indicators otherwise you are going to be influenced by the indicators.
I am done for now, will try again at 11 my for some after lunch activity. 5 trades with 1 big win, PA was ok today but for some reason feeling uncomfortable for me. Not sure why.
What Vidvad told you was correct. If you want to learn PA then use a chart without indicators otherwise you are going to be influenced by the indicators.
Ignored
Attached Image (click to enlarge)
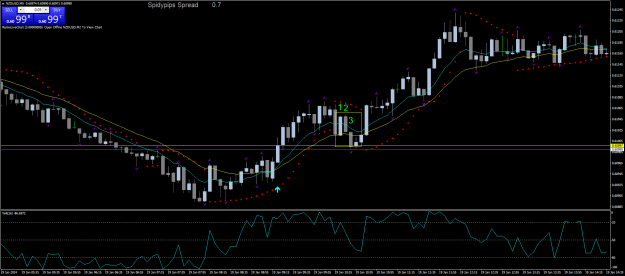
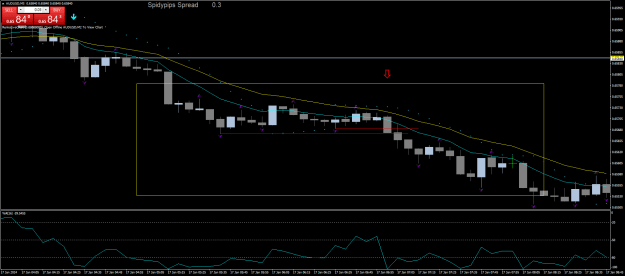
ok guys i understand what you both are saying but my question hasnt been answered. here is a new example that is aligned with your trading system just like the last example was
{quote} {image}ok guys i understand what you both are saying but my question hasnt been answered. here is a new example that is aligned with your trading system just like the last example was
Ignored
as you can see the candle with arrow has closed past the last swing low and not the swing low on the major structure. is that a valid break of structure?
{quote} as you can see the candle with arrow has closed past the last swing low and not the swing low on the major structure. is that a valid break of structure?
Ignored
Where does rocky talk about break of structure? It's been a long time since I studied his original method and I don't recall him using that terminology, but it could just be my memory has faded. WOuld you quote one of his posts where he mentions this as a requirement to take a trade?
My objective is to learn the skill of flawless execution of my trading plan