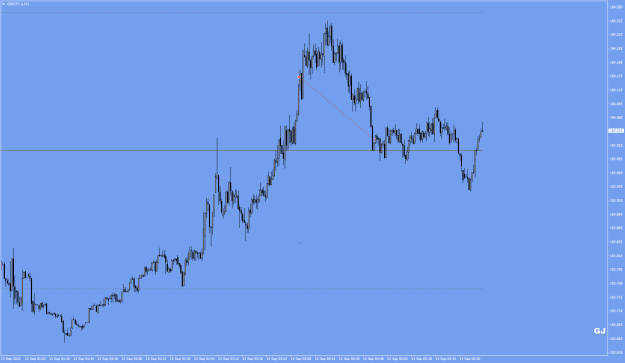
Disliked{quote} You only have to take a look at the Crude Oil Chart, tells you where the money flow is.Ignored
Traded Oil long from 8:12 & 8:20 ish...
Doing exactly what you just said... following the flow
Entering on breaks of structure on 1m and 5m.
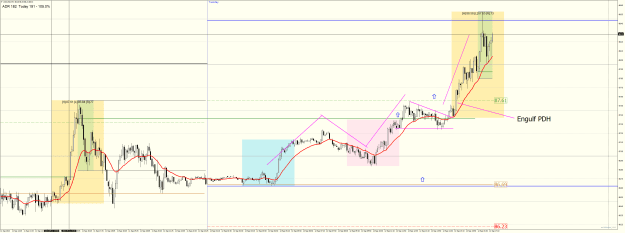
Price above PDL
Price above PD NY close/DOL
Price engulfs Prev day NY equity open (green line)
Price engulfs PDH..
Where might the market go ??
I didn't ride all the way up as I was expecting a strong reversal near NY equity open...
I closed my longs each @+50
Then shirred the market right at the top on the 1min Doji at ADR high and added in... price did not move fast enough for me... Time decay..if price does not move quickly or strong enough away from the high....chances are I havent sold the high and it will come back...
So waited and when I thought nope not moving strong enough for me..closed shorts +30ish +20ish and hung it up for the day..
Also was some stellar trades on US30 that I didn't take as to tied up watching oil... but did screenshot all as it happens..
Sometimes it's as simple as follow the bouncing ball..and just look for a entry that is favorable...ie break of market structure... go with the flow..
Thank you Shabs for pointing this out ..had to chuckle when I read your post...I thought BANG on Shabs!!
Cheers
Blue
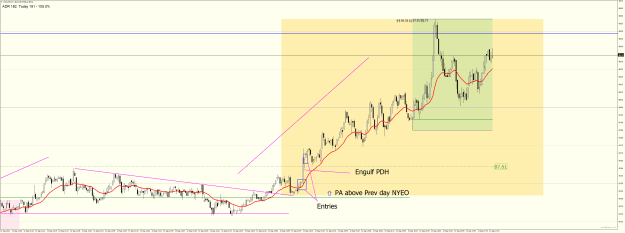
I had marked out a descending triangle (pink)
Normally bullish...but a break to the upside is a bullish reversal signal...in line with the flow..and with timing.. NY premarket open...
..
.
Attached Image (click to enlarge)
Attached Image (click to enlarge)
The Best Loser Wins
9