Someone can make a zigzag indicator.
1. It should build its vertices depending on the minimum number of points passed by the price (set in the parameters for example 12500) and put a label on the chart (red and yellow star).
2. If the price has passed twice as much, then another label is put (blue star) 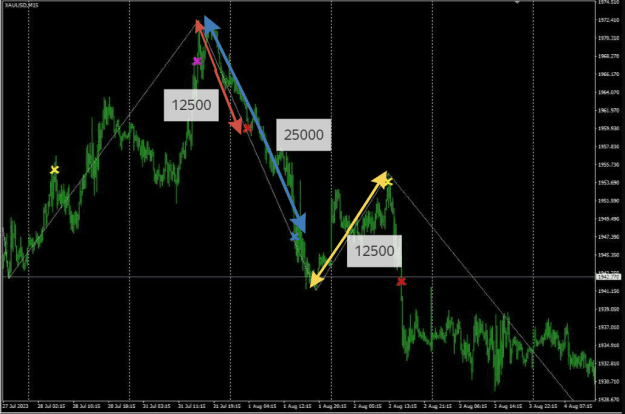
1. It should build its vertices depending on the minimum number of points passed by the price (set in the parameters for example 12500) and put a label on the chart (red and yellow star).
2. If the price has passed twice as much, then another label is put (blue star)
Attached Image (click to enlarge)
Attached File(s)