I ran some backtest using the replay button on tradingview, and found these consecutive losses. Would be good if anyone here can go back to the same time period to verify if you see the same valid setups (and losses!) {image}
Ignored
Hello Tibetian.
I'm glad you've raised this issue. Some 15 days ago, I had made a similar comment, on post 86 (you can click through to it). I started backtesting data from 2015, and the results were definitely unimpressive. Like a streak of 7 to 10 consecutive loses, and several months each ending in a net loss. It was very surprising, but I decided to stick with it a bit more, and see if I was missing something. Since then, there have been a few more videos released by Scott, with additional information, and I've incorporated this into my backtesting, discarding old tests whenever I get new information about this system. But even now, the results remain appalling. Haven't yet seen the win rates that Scott is advertising.
I would encourage other members here to also share what kinds of outcomes they are getting with this system. Maybe there's something we are missing. But I doubt that's the problem.
0345 trade setup candle was marked by candle 1 0445 trade setup candle was marked by candle 3 Candle 2 swept the M15 Range High (External), and Candle 3 represents the Extended Sweep from Candle 2. Even without considering the M15 External Range sweep, all the subsequent candles from candle 1 are valid Extended Sweep Candles. The next candle after candle 3 triggered the sell stop order. {image}
Ignored
This was a valid trade entry, 1iquidity. Tibetian would have entered that trade after the 15 minute external range had been breached.
{quote} Hello Tibetian. I'm glad you've raised this issue. Some 15 days ago, I had made a similar comment, on post 86 (you can click through to it). I started backtesting data from 2015, and the results were definitely unimpressive. Like a streak of 7 to 10 consecutive loses, and several months each ending in a net loss. It was very surprising, but I decided to stick with it a bit more, and see if I was missing something. Since then, there have been a few more videos released...
Ignored
Ive not actually done a formal backtest. Im currently forward testing with a small amount of equity, once I take 10 losses in total, I will asses the R multiple, which will be either positive or negative.
From this week ive taken 5 trades 2 wins, 3 losses, 40% WR, +3R.
Despite this though im still ultra sceptical about it being a working strategy, there just isnt enough TA in the method to result in profitability (in my opinion), but I will see the test through anyway out of foolishness
One thing that might have an effect on testing results is the types of trades taken....
When the strategy was first introduced, there was no SFT, and no counter trades, it was simply either FT or NFT, and also there was no internal 15M range trades either, these were added in at a later date. Im assuming these add-ons of SFT trades, Counter Trades and Internal range trades were introduced to increase the trade frequency at the cost of lower probability.
Even without testing, Ive got a hunch that only sticking to higher probability scenarios I.E FT/NFT, no countering, and no internal range trades will yield slightly better results albeit with much less opportunities. ... When I say better... I still dont necessarily think it will be profitable, but am open to being proved wrong.
{quote} Hello Tibetian. I'm glad you've raised this issue. Some 15 days ago, I had made a similar comment, on post 86 (you can click through to it). I started backtesting data from 2015, and the results were definitely unimpressive. Like a streak of 7 to 10 consecutive loses, and several months each ending in a net loss. It was very surprising, but I decided to stick with it a bit more, and see if I was missing something. Since then, there have been a few more videos released...
{quote} Ive not actually done a formal backtest. Im currently forward testing with a small amount of equity, once I take 10 losses in total, I will asses the R multiple, which will be either positive or negative. From this week ive taken 5 trades 2 wins, 3 losses, 40% WR, +3R. Despite this though im still ultra sceptical about it being a working strategy, there just isnt enough TA in the method to result in profitability (in my opinion), but I will see the test through anyway out of foolishness
Ignored
Do keep us updated on how the forward testing turns out, Paul. Personally, I find backtests to be quicker and more efficient, and they involve less emotional investment. See, in a forward test, you might start just when, by sheer luck, there are market conditions that make you have a streak of wins, and you might think the strategy is working, only for the variance to swing the other way, when you've already invested like several weeks or even months into it, and probably even moved to a bigger trading account. That can be heartbreaking.
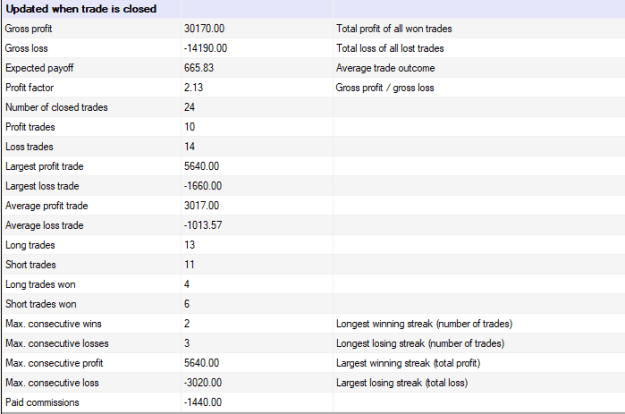
Hi, I have backtested from 01.01.22 until 07.03.22 11:00 taking a brake and will maybe continue tomorrow. Here are my test results so far: {image} edit: did the test on a 100.000 account, but i have fixed lot size at 10 lot. (didn't boder to take accurate 1% of each trade)
Ignored
I calculated that i'm up 172 pips on EU in about 2 mnd time
Hi, I have backtested from 01.01.22 until 07.03.22 11:00 taking a brake and will maybe continue tomorrow. Here are my test results so far: {image} edit: did the test on a 100.000 account, but i have fixed lot size at 10 lot. (didn't boder to take accurate 1% of each trade)
Ignored
Hey El:
Are you using any additional analysis or consideration that hasn't been described in this thread so far? Because your results look very different from what I'm getting. I haven't yet backtested the period you've specified here, but I have doubts I'd get anything close to your results.
Are you counter-trend trading?
Are you distinguishing between Strong Follow Through, and Weak Follow Through?
{quote} Do keep us updated on how the forward testing turns out, Paul. Personally, I find backtests to be quicker and more efficient, and they involve less emotional investment. See, in a forward test, you might start just when, by sheer luck, there are market conditions that make you have a streak of wins, and you might think the strategy is working, only for the variance to swing the other way, when you've already invested like several weeks or even months into it, and probably even moved to a bigger trading account. That can be heartbreaking....
Ignored
Not optimal I know, just the way I like to do things. I prefer live time execution.
{quote} Hey El: Are you using any additional analysis or consideration that hasn't been described in this thread so far? Because your results look very different from what I'm getting. I haven't yet backtested the period you've specified here, but I have doubts I'd get anything close to your results. Are you counter-trend trading? Are you distinguishing between Strong Follow Through, and Weak Follow Through?
Ignored
Hi,
In the start of the year I did try to counter trend, but I saw I got more loss then wins, so I only traded SFT and WFT.
Interesting to see that if you have two 4H candle in one direction passing premium/demand it is a sign of SFT and you should not trade agains this trend, what I mean is that passing the premium/demand you should normally take a counter trade, but I found out that I had a lot of losses in this mid area
{quote} Hi, In the start of the year I did try to counter trend, but I saw I got more loss then wins, so I only traded SFT and WFT. Interesting to see that if you have two 4H candle in one direction passing premium/demand it is a sign of SFT and you should not trade agains this trend, what I mean is that passing the premium/demand you should normally take a counter trade, but I found out that I had a lot of losses in this mid area
Ignored
Wait. At the start of the year? Were you aware of this trading system in January?
Also if there are other considerations you've incorporated into your analysis that haven't been mentioned elsewhere, kindly continue sharing them. About those two same direction candles: do you mean when they pass the equilibrium line?
{quote} Wait. At the start of the year? Were you aware of this trading system in January? Also if there are other considerations you've incorporated into your analysis that haven't been mentioned elsewhere, kindly continue sharing them. About those two same direction candles: do you mean when they pass the equilibrium line?
Ignored
In the start of the year in the test Sorry my English is not that good
Yes I think about the equilibrium (or 50% retrace in a fib) and yes normally you should the continue down to test the low again, but I see that price has a tendency to wick both way around this area, so I stopped taking trades in the last weeks of the test.
Also I only got about 2-3 trades a week (9 weeks test 24 trades)
One more thing, my results are only after 9 weeks, I can get a period of losses, so I have to test many more weeks before we can conclude if this is a good system.
And My kill time is the same as Scott has now (07:30-10 and 13-15 uk time)
{quote} In the start of the year in the test Sorry my English is not that good Yes I think about the equilibrium (or 50% retrace in a fib) and yes normally you should the continue down to test the low again, but I see that price has a tendency to wick both way around this area, so I stopped taking trades in the last weeks of the test. Also I only got about 2-3 trades a week (9 weeks test 24 trades)
Ignored
2 or 3 trades a week are fine, if the win rate can be improved.
Listen, which software are you using for your backtest? If it is Soft4fx, then you could send me your backtest simulation file, and I can go through those 24 trades you've taken, and probably detail out the common conditions I see in them here. I'm pretty good at breaking down abstract ideas into easier to follow storylines or set of instructions.
One more thing, my results are only after 9 weeks, I can get a period of losses, so I have to test many more weeks before we can conclude if this is a good system. And My kill time is the same as Scott has now (07:30-10 and 13-15 uk time)
Ignored
Even those results for only 9 weeks are very impressive. Like I had stated before, I haven't found a single month in my backtests where the net was a profit. They are all ending as net losses. So it's possible you are doing something that's making a huge difference.
Your killzones are fine. I'm using the exact same ones.
Also if you are using Soft4fx, could you click at the "Trades" tab, then the "Graph" tab within it, and send us a screenshot of the equity curve of those 24 trades?