Joined Dec 2006
|
Status: The price is right.
|782 Posts
Just thought that I would put together a set of charts for the EUR and then follow along with the signals in each of three time frames and see what happens. I particularly like the look of the signals in the 4 hour timeframe, also suits my personal timeframe.
Attached Images
Stay calm, be brave, wait for the signs - Jasper Friendly Bear
Joined Dec 2006
|
Status: The price is right.
|782 Posts
The 1 hour timeframe also looks interesting. I am curious to see how signals here act as a lead in to the 4 hour timeframe signals. Anyway, those are my three favourite timeframes to trade with.
Reading this thread has been a great inspiration. The combined cooperation, creativity, talent, problem solving and persistence deserves a pat on the back and a well deserved thank you! THANK YOU!!
Attached Image
Stay calm, be brave, wait for the signs - Jasper Friendly Bear
Joined Dec 2006
|
Status: The price is right.
|782 Posts
Choppy price action seems to play havoc with the signals. Perhaps some of the most difficult type of price action for any system to accurately respond to.
Attached Image
Stay calm, be brave, wait for the signs - Jasper Friendly Bear
Great job on all the fine work and accomplishment to all contributors. Thanks for all of your help. Hopefully I can help in some way after I start testing.
Good to hear that your compiling problem was solved. If you give a little detail of how you solved it, it might be useful for others (in case if somebody gets similar problem).
Hi Marc,
I have made another update where the Trend from next higher timeframe to the current chart will also be included in the Comment and email. The emails can be filterted by signal strength and slope (the slope will help avoid sideways market, default is no filter). I have sent it to Snobol. Since I keep my version somewhat different, he may take sometime and I hope eventually release a new update.
Here is a sample of emails I am getting from my indicator. This is an example of a choppy market (with potential for reversal?). The slope is not filtered here. The higher timeframe is already defined for each chart timeframe. (The alignment may be messed by FF formatting)
Quote
Disliked
EURJPYm 1H 4H
----------------------------
TSS -->> BUY_ SELL
Slope -> -0.5 1.2
SAR -->> SELL (buy)
----------------------------
2007.05.22 10:21; [Minutes left in the current bar = 38]
Todays OHLC prices are: 163.52, 163.59, 163.24, 163.43
Thanks for the feedback...How do you incorporate the signal strength and slope in regards to avoiding the choppy markets? Any help, would be much appreciated.
What typically do you input for the slope, what do you look at??
Hi Marc,
I have made another update where the Trend from next higher timeframe to the current chart will also be included in the Comment and email. The emails can be filterted by signal strength and slope (the slope will help avoid sideways market, default is no filter). I have sent it to Snobol. Since I keep my version somewhat different, he may take sometime and I hope eventually release a new update.
Here is a sample of emails I am getting from my indicator. This is an example of a choppy market (with potential for reversal?). The slope is not filtered here. The higher timeframe is already defined for each chart timeframe. (The alignment may be messed by FF formatting)
-chandra
Joined Dec 2006
|
Status: The price is right.
|782 Posts
O.K.--- just fooling around with the indicators to get a set up that works for me:
OT3MAV3 yellow 4,1.5
T3MA_mod_2 red 6,1.5
HMA%20modified blue, magenta hma8
T3MA_mod_2 green 21,0.7
Dynamic Zone RSI green,yellow 8,20,8
Stochastic dogerblue,dogerblue 5,3,3
When the OT3MAV3 "and" T3MA "and" HMA "and" RSI "and" Stochastic cross, only then does it seem like there is a chance for a high probability trade in your favour. If "any" one of the indicators contradicts then chances are much less likely that the trade will go in your favour. Look at the verical red lines on the chart and draw your own conclusions as to how well this approach works to filter the trades. An LRC channel is a great visual aid to help identify those all important support/resistance levels. My favourite trades are those that are likely to go across the channel with the LRC median being take profit areas as oppossed to entry areas. The red T3MA may have possibilities as a way to manage stop loss placement. I guess that a bit of forward testing is in order to prove(disprove) the worthiness of this approach. Your feedback is much appreciated.
Attached Image
Stay calm, be brave, wait for the signs - Jasper Friendly Bear
Joined Dec 2006
|
Status: The price is right.
|782 Posts
The rectangular area highlighted in the above chart shows an area of whipsaw and false signals. How do we avoid those trades?
1st yellow arrow - no trade - no RSI cross
1st magenta arrow - no trade - no OT3 and T3MA cross
2nd yellow arrow - no trade - HMA is wrong colour
2nd magenta arrow - no trade -no OT3 and T3MA cross
3rd yellow arrow - no trade - no OT3 and T3MA cross
Patience is definately a virtue in the game of Forex. I try to define my trade criteria and then patiently wait for the market to come to me (old stock market swing traders approach). NO! I am not that ancient, only like fine wine, well seasoned .
Stay calm, be brave, wait for the signs - Jasper Friendly Bear
Joined Dec 2006
|
Status: The price is right.
|782 Posts
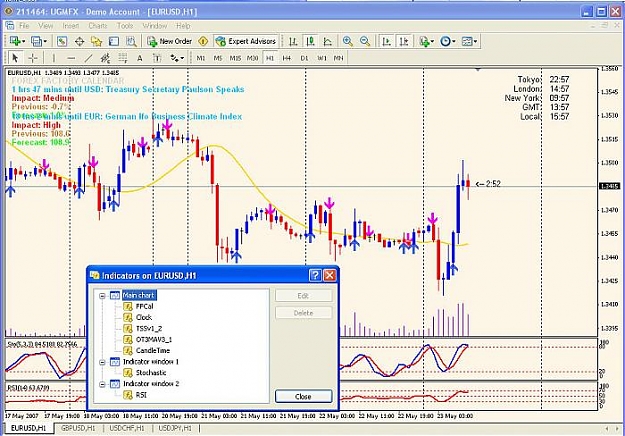
Currently there are four recent arrows that have printed. The two yellow arrows are a no trade because the HMA is the wrong colour. The two magenta arrows are no trade because there is no OT3 and T3MA cross. Don't you absolutely love it when evaluating whether or not to take a trade is just that easy .
Attached Image
Stay calm, be brave, wait for the signs - Jasper Friendly Bear
Good to hear that your compiling problem was solved. If you give a little detail of how you solved it, it might be useful for others (in case if somebody gets similar problem).
-chandra
Ignored
Hi Chandra,
I have been trying this system but when I changed to another broker using its MT4 with different GMT, the TSS got errors when compiling and didn't work at all. After some trials, I download the most updated verison of MT4, the TTS works again. Perhaps the MT4 from that broker is outdated. Thanks for your concern and great work.
I've uploaded the latest update for the TSS Indicator. All seems to be OK but I do not get an Alarm when when the Arrows appear. Did I omit something? See setup attached.
I've uploaded the latest update for the TSS Indicator. All seems to be OK but I do not get an Alarm when when the Arrows appear. Did I omit something? See setup attached.
SA Greetings
Ignored
Hi there
go to indicator list , select TSSv1_2 and edit ,
TAB "Inputs" , set the alarmset to true and set the alarm2Mail to false..
and you will have sound with the alert....
I had a same problem with you last time..
by the way , can you share your FF calender to me thanks
Thanks for the feedback...How do you incorporate the signal strength and slope in regards to avoiding the choppy markets? Any help, would be much appreciated.
What typically do you input for the slope, what do you look at??
Thanks so much..
M.
Ignored
Hi Marc,
The following quote was mentioned by Snobol in an earlier post, but nothing much has been developed/standardized for this.
"if the slope of the trend becomes too shallow, don't trade"
The slope is just pips per bar the MA moves (50-LWMA used). I think at least 1 should be used, but it will depend on the pair and Timeframe. For example, 1 pip in GBPUSD is lot small compared to 1 pip in USDJPY. 1 pip average move in 4H is lot less compared to 1 pip average move in 1H. On average, 1 for 1H chart seems to be good as far as I checked EURJPY. For 4H chart, at least a double of that will be good. These are just to give some preliminary idea (in my latest version it will be used to reduce emails only). Further estimate of whether there is a trend (or wide enough range) will be needed before considering new position.
Also, if the slope is increasing (say from 4 in previous bar to 5), it means uptrend is gaining momentum (and only up signals should be considered). If the slope is falling (say from -2 to -3), the good downtrend is in effect. On the otherhand, if the slope is weakening (from 3 to 2 or -3 to -2), it means the end of current Trend is near and either a consolidation or reversal is expected (one should use more caution).
Signal strength is exactly similar to Slope, only difference is that it uses the slope of same MA used to generate the signal (by default 4,1.5). Unlike slope filter, this will stop the signal itself (along with email and alerts). Numbers similar to the slope filter should be OK here also.
I hope this summarizes what I think about using the slope for evaluating the Trend. In addition, The OT3MA longer term trendline can also be used for the Trend direction, as described before. Similar trend strength evaluation can be applied there also.
-chandra
Addition: Also if the slope is moving opposite, one should be careful or avoid, I think.
(if the slope is positive, use buy signals only; if it is negative, use sell signals only).
O.K.--- just fooling around with the indicators to get a set up that works for me:
OT3MAV3 yellow 4,1.5
T3MA_mod_2 red 6,1.5
HMA%20modified blue, magenta hma8
T3MA_mod_2 green 21,0.7
Dynamic Zone RSI green,yellow 8,20,8
Stochastic dogerblue,dogerblue 5,3,3
When the OT3MAV3 "and" T3MA "and" HMA "and" RSI "and" Stochastic cross, only then does it seem like there is a chance for a high probability trade in your favour. If "any" one of the indicators contradicts then chances are much less likely that the trade will go in your favour. Look at the verical red lines on the chart and draw your own conclusions as to how well this approach works to filter the trades. An LRC channel is a great visual aid to help identify those all important support/resistance levels. My favourite trades are those that are likely to go across the channel with the LRC median being take profit areas as oppossed to entry areas. The red T3MA may have possibilities as a way to manage stop loss placement. I guess that a bit of forward testing is in order to prove(disprove) the worthiness of this approach. Your feedback is much appreciated.
Ignored
Hi,
Can you post your T3MA_mod_2 and Dynamic Zone RSI MT4 Indicator? thanks