Hi,
I'm sure a lot of you already know about Gap trading.
I am posting the Gap finder indicator.
I have found this on this website, dunno who's it is.
Anyway, in the input section of the indi you can adjust the minimum size of the gap you want to be looking for.
I adjusted mine to 10 pips .
After you place it on your'e chart you can either use it with jap. candles or switch to line chart.
The line chart is good if you want to do historical check on the sizes of the individual currency pairs gaps.
I checked back about 6 months of 6 currencies. This is tedious so I stopped.
I found that the biggest gaps are created by GBP/NZD.
Howeve the gaps are 95 percent of the time created when the market opens on sunday(NY,east) and thats when the spreads are the widest.
So average gap for GBN/NZD was around 35 pips. When I checked it last Sunday after the market opened the spread was 29 pips.
So obviously you cant trade that.
But the next best pair was EUR/AUD and the average pip gap was about 22 pips and the best thing was the gap was closed most of the time. Meaning the price returned to original price of Friday close.
And last Sunday I waited to see the spreads and by 5.30 pm Est time the spread for Eur/Aud reduced to about 6 pips. So I took the trade and gained 18 pips.
Now this is the way to trade the gap, as soon as Sunday opens the gap is produced, so you check the size of the gap and compare it to the spread, if you think its worth trading do it, if not wait for the spread to go down and than trade.
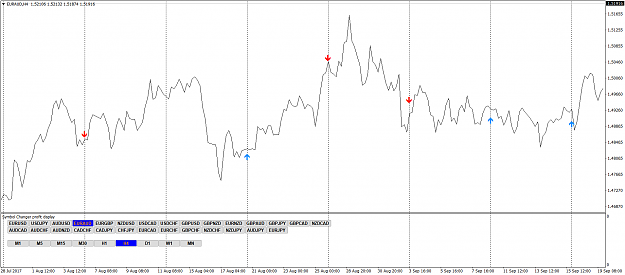
The line chart has arrows showing the gaps they are almost always at the week opening on sunday.
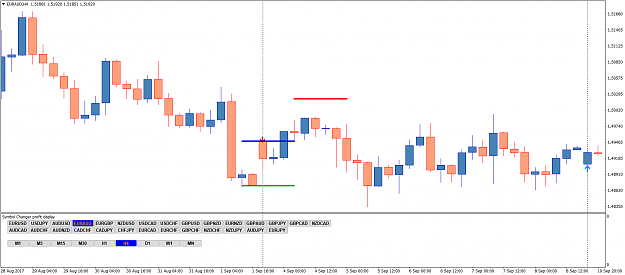
The candle stick chart you can see an example of how to trade the gap.
The blue line is the opening price on Sunday 5 pm Est/ny.
The red line is your SL it is measured from Friday close price to Sunday open price.
The green line is your TP.
I did not put an entry line there as you can see.
As I mentioned earlier the spread is too big when the price first opens so you have to wait for the spread the go down to manageable levels.
If you check back in history most currencies will fill the gap most of the time. Its almost like guaranteed money in your pocket but no so. Because of the spread.
So you have to check live every sunday 5pm.
P.S. the usd/jpy for the months I checked kept going opposite direction of the gap without filling it. So thats something else to look into.
And dont forget the Eur/Aud spreads returned to normal pretty fast and its the one with bigger gaps and more consistent gap fills.
Also in the below example the Gap was about 75 pips so you might take a chance and enter right away even if the spread was say 12 pips. Why? because alot of times the price fills the gap early.
I'm sure a lot of you already know about Gap trading.
I am posting the Gap finder indicator.
I have found this on this website, dunno who's it is.
Anyway, in the input section of the indi you can adjust the minimum size of the gap you want to be looking for.
I adjusted mine to 10 pips .
After you place it on your'e chart you can either use it with jap. candles or switch to line chart.
The line chart is good if you want to do historical check on the sizes of the individual currency pairs gaps.
I checked back about 6 months of 6 currencies. This is tedious so I stopped.
I found that the biggest gaps are created by GBP/NZD.
Howeve the gaps are 95 percent of the time created when the market opens on sunday(NY,east) and thats when the spreads are the widest.
So average gap for GBN/NZD was around 35 pips. When I checked it last Sunday after the market opened the spread was 29 pips.
So obviously you cant trade that.
But the next best pair was EUR/AUD and the average pip gap was about 22 pips and the best thing was the gap was closed most of the time. Meaning the price returned to original price of Friday close.
And last Sunday I waited to see the spreads and by 5.30 pm Est time the spread for Eur/Aud reduced to about 6 pips. So I took the trade and gained 18 pips.
Now this is the way to trade the gap, as soon as Sunday opens the gap is produced, so you check the size of the gap and compare it to the spread, if you think its worth trading do it, if not wait for the spread to go down and than trade.
The line chart has arrows showing the gaps they are almost always at the week opening on sunday.
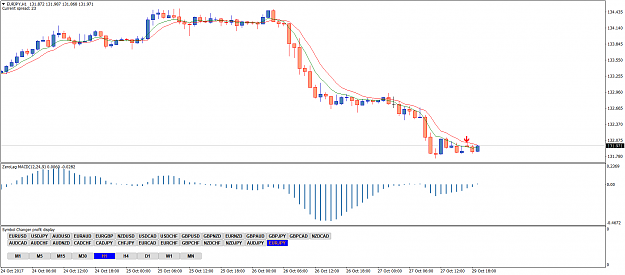
The candle stick chart you can see an example of how to trade the gap.
The blue line is the opening price on Sunday 5 pm Est/ny.
The red line is your SL it is measured from Friday close price to Sunday open price.
The green line is your TP.
I did not put an entry line there as you can see.
As I mentioned earlier the spread is too big when the price first opens so you have to wait for the spread the go down to manageable levels.
If you check back in history most currencies will fill the gap most of the time. Its almost like guaranteed money in your pocket but no so. Because of the spread.
So you have to check live every sunday 5pm.
P.S. the usd/jpy for the months I checked kept going opposite direction of the gap without filling it. So thats something else to look into.
And dont forget the Eur/Aud spreads returned to normal pretty fast and its the one with bigger gaps and more consistent gap fills.
Also in the below example the Gap was about 75 pips so you might take a chance and enter right away even if the spread was say 12 pips. Why? because alot of times the price fills the gap early.
Attached Image(s) (click to enlarge)