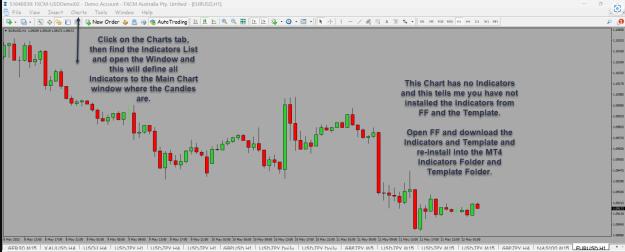
I think it is important to also show the losing trade days for a balanced view of the strategy.
Attached Image (click to enlarge)
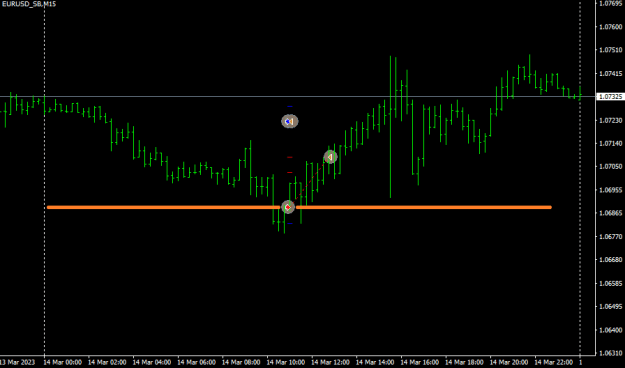
The picture above is of a losing trade. Yes the trade could have been taken a few bars back and reach 5 pips, but the time filter prevented that occurring.
Whilst it would have met the 5 pip target, trying for anymore pips leads to a loss.
These spikes are the issue as price never returns below the level again on the day shown. It is my preference to close all trades on the day they were taken so swap charges are avoided.
This why the filtering by time and pip target is important.
Yes other filters can be used, but is not true to the strategy being presented. As it complicates the process and begins to move away from a pure rule based system.
As stated in the first post, using time filter and pip target alone has shown 80-90% win rate. The losing trades can be dealt with via trade management.
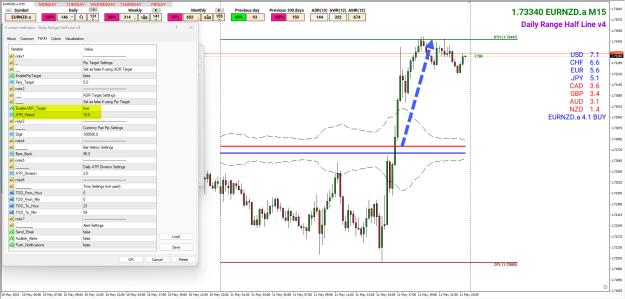
I saw cpfleger pictures and thought the DHR indicator may need some attention regarding the pip target. The ADR can be wavey as it is set to current chart time per bar. So reflects movement of ADR during the day. The ADR is based on period and not percentage. I will make the ADR multi time in due course; which will make a constant level dotted line. The trade on the chart looks good; if taken. The losing trade shown in Post 22# is based on using ATR target, which unfortunately thought there should be 7 pips instead of 5 pips.
Ignored
But my question; what does the setting mean?
How do we know what ADR is being used, and how to set a percentage of that for the TP targets?
Thanks
If you trade like me, you'll be homeless and broke within a week.
{quote} But my question; what does the setting mean? How do we know what ADR is being used, and how to set a percentage of that for the TP targets? Thanks
Ignored
Sorry added the answer to your question in Post 24#
"The ADR is based on period and not percentage."
ATR of other time frames below a Day will change over the day. If based on daily ATR, will have to use day+1 to prevent it changing through the day.
Firstly, this is a pure rule based method, so it can be scientifically and statistically measured in a reproducible way.
The goal is to have profitable trades consistently day after day. This needs to be based on probability and risk calculations.
The small pip target is based on probability and risk. If a market moves on average, say 50-100 pips per day and a trader wants 100 pips the probability of achieving 100 pips is statistically very low. Due to spread, the inherent way price moves, where the trade is entered etc...... It is like trying to pin the tail on the donkey for trade entry and then saying ok price will now move 100 pips from this point in a certain direction.
As the number of pips per trader decrease the probability of achieving those pips increases; inversley proportional.
The obvious starting point is the minimum average range per day, as given the above, we are unlikely to get 100% of this value given trade entry is like pinning a tail on the donkey.
Looking at standard distribution, mean, CV value etc.... a 5 pip target has a very high probability taking into account spread.
Another way to look at the pip target is... If you knew the probability of reaching the 5 pip target was ~>95%; how many lots would you trade per pip?
This way of thinking allows for automation of the method with probability of success leaning towards the trader.
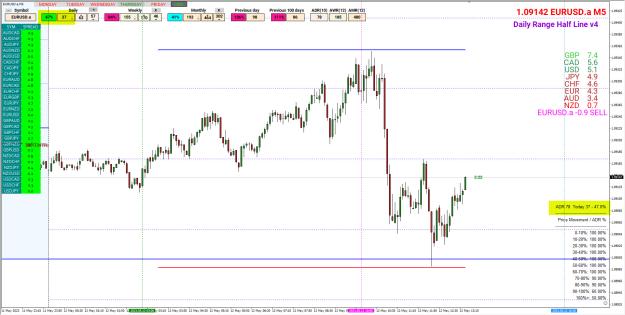
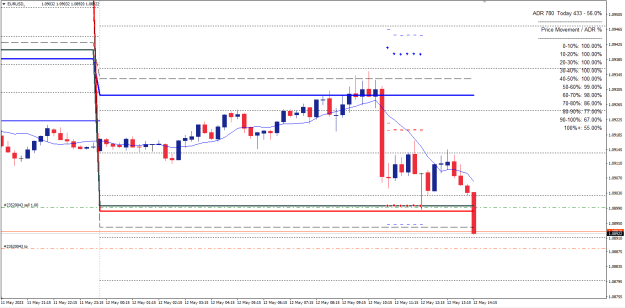
Todays trade on EURUSD 15M: {image} This is a perfect example of when the trade potentially will not work out. This does not happen often but be aware. Time will tell if price decides to come back down given it is Friday and there is USD data later today
Ignored
That just barely touched yesterday's low, only showing 47% on my broker
With a 5 pips TP, how negative is the risk reward ratio?
Attached Image (click to enlarge)
If you trade like me, you'll be homeless and broke within a week.
{quote} Erebus thanks for the comment. Good point and to take into account price in reference to previous day high and low. Please find Previous day High / Low indicators attached{file} {file}
Ignored
I use Daily Line Boxes indicator, the updated version is awesome and free here on FF, also has an On/Off button function.
Also watch last week's high and low for interest.
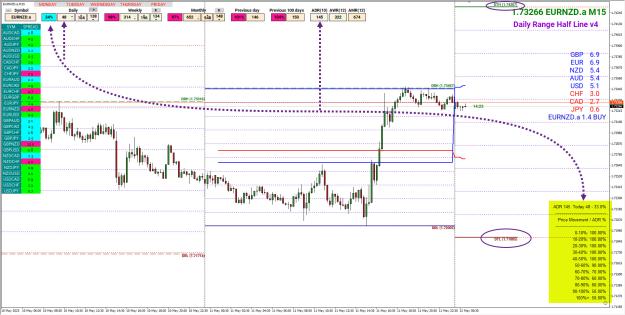
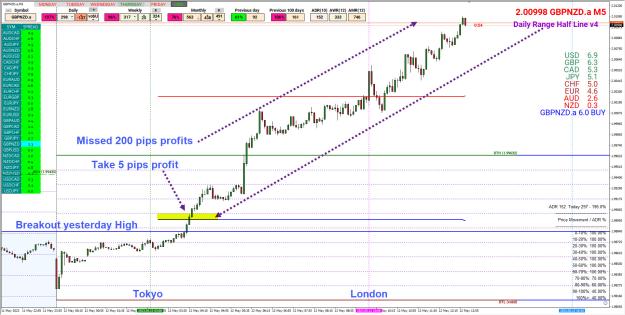
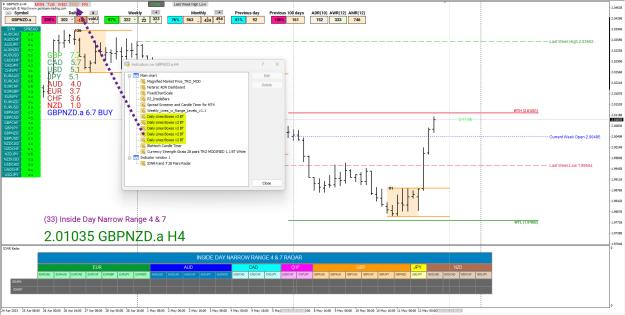
Look at this GBPNZD just destroying the price action, now 200% ADR(10)
Attached Image (click to enlarge)
If you trade like me, you'll be homeless and broke within a week.
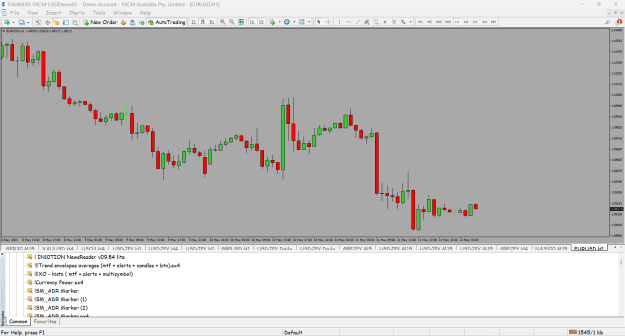
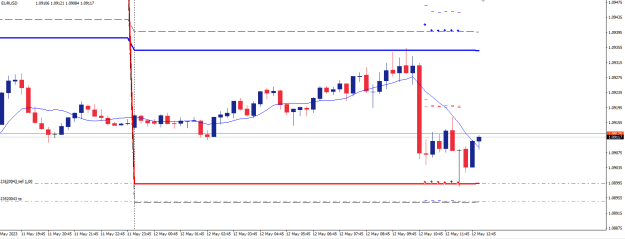
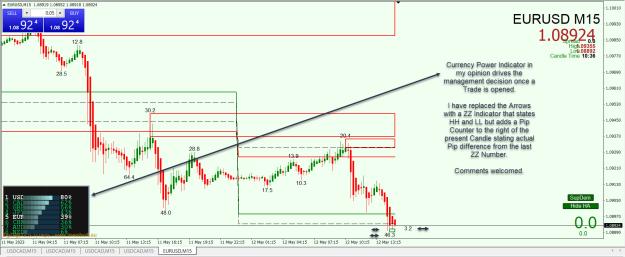
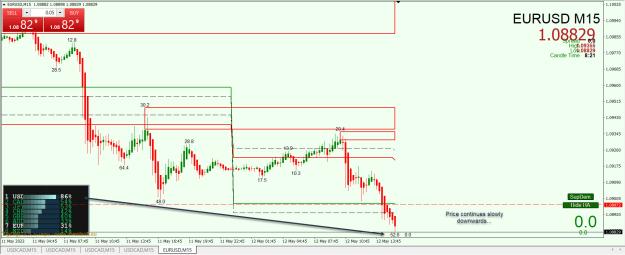
Trade worked out on EURUSD 15M. That was a bit scary but backtesting has shown the method works 80-90% of the time. The trade today was in essence a breakout of the previous day low. Note grey line at the red sell line. Trade entered at the daily low followed by pullback and then price returned to bear trend and formed lower low. This is why I have mentioned about restricting the trading time to avoid entry at the first test. I think it better to show live trades and then members can decide for themselves about the strategy. Thanks Erebus for the...
Ignored
Also the curreny power indicator given by cpfleger was in favour of EUR weakness.