GBPUSD Notable number is "00". This is according to "round numbers" psychology. BUT... this works when there were enough strong trend to reach that notable number level. Not very much signals.. But they are highly profitable. For example, our notable special price is 1.3700 BUY when the previous 22 days high/low prices are above our notable price level with "00" so the price reaches "00" from above. SEll when the previous 22 days high/low prices are below our notable price level with "00" so the price reaches "00" from below. TP 0.4%, SL 0.4% You...
And therefore started a new experiment - Synthetic symbols created in MT5 with formulas from existing currency symbols.
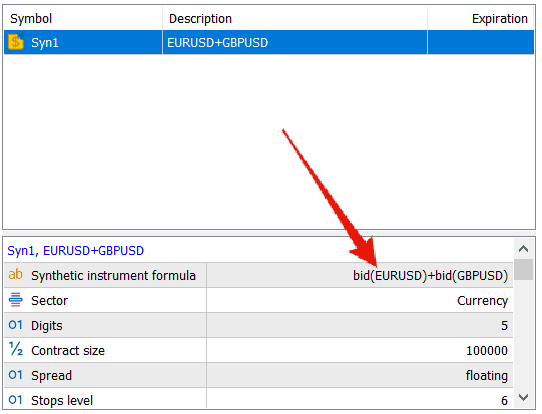
For example, here we can create a new synthetic symbol with the formula: price=EURUSD + GBPUSD
Attached Image (click to enlarge)
Formulas can be anything.. As we see from the MQL5 website then we can build any kind of synthetic assets for example here complex formula for the dollar index USDX:
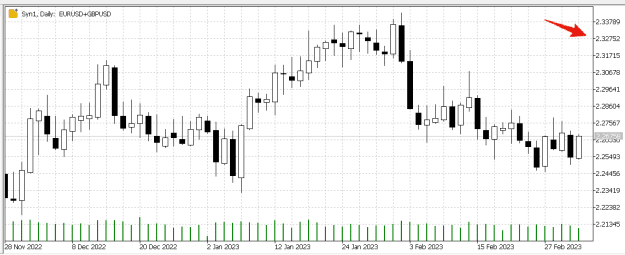
Here how it looks my new synthetic symbol "Syn1" chart:
Attached Image (click to enlarge)
And now we can find notable numbers entries as it was done previously but with one different rule: we open 2 deals for each symbol (in this case EURUSD and GBPUSD) both in the same direction and TP/SL is monitored for Syn1 and closed both opened deals accordingly. No hard TP/SL is possible here - deals must be closed by an EA. There are available free EAs that can do that (close all opened deals according to targets) if you trade this strategy manually.
This is for what I now will make an analysis - to find out combinations of tradable pairs and targets.
a new experiment - Synthetic symbols created in MT5 with formulas from existing currency symbols
Ignored
Synthetic symbols that combine several currencies will only make sense with some additional manipulation. If you do not equalize/normalize/weigh it somehow then some symbols inside will have more effect and some can be almost invisible.
For illustration, you have a currency pair X that's 100.00 and a currency pair Y that's at price 1.00 right now. If you add it up you get Z = 101. If X increases 10% then Z=100*.1+1=112. If Y increases 10% then Z=100+1*.1=101.1. So X currency pair will dominate the synthetic combined price and you would not even notice effects from currency Y on the combined price.
{quote} Synthetic symbols that combine several currencies will only make sense with some additional manipulation. If you do not equalize/normalize/weigh it somehow then some symbols inside will have more effect and some can be almost invisible. For illustration, you have a currency pair X that's 100.00 and a currency pair Y that's at price 1.00 right now. If you add it up you get Z = 101. If X increases 10% then Z=100*.1+1=112. If Y increases 10% then Z=100+1*.1=101.1. So X currency pair will dominate the synthetic combined price and you would not...
Ignored
You are right.
Here is what can be done:
Quote
Disliked
1. Convert both currency pairs to a common currency: To create a normalized synthetic asset, you need to convert both currency pairs to a common currency. One option could be to convert both pairs to USD. For example, to convert EURUSD to USD, you would multiply the EURUSD price by the USD value of 1 EUR. Similarly, to convert AUDCAD to USD, you would multiply the AUDCAD price by the USD value of 1 AUD.
Quote
Disliked
2. Add the two currency pairs: Once you have converted both currency pairs to a common currency, you can add the two prices to get
Quote
Disliked
3. Normalize the combined price: To normalize the combined price, you need to divide it by a normalization factor. The normalization factor should be equal to the number of currency pairs you are combining. In this case, we are combining two currency pairs, so the normalization factor is 2. For example, if the combined price is 2.10 USD, then the normalized price would be 2.10 / 2 = 1.05 USD.
{quote} EA opens correct on round numbers as you can see in myfxbook: {image} But there are some seconds till published in website and pushed signals to subscribers. Therefore might be 1 or 2 pips difference. Anyway each broker can have different quotes..
Ignored
I think we have a different definition of round number.
Apologies if my questions are intrusive. I just want to understand.
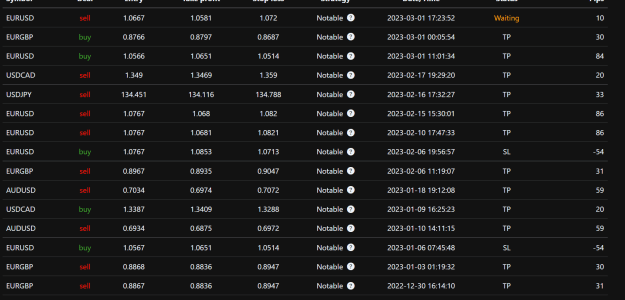
In this most recent signal, the entry was taken last week and would have exited profitably on 2022-03-02 ~18:00, I believe.
Why is it status: waiting?
Also it says pips: 10 but from 1.0667 to 1.0581 is ~86 pips.
I think I understand how the levels work. They are at a fixed distance of 100 pips but at any value that ends in 66 (for EURUSD)?
In that case I wonder why the first trade in the list is a buy (2023-01-06) when price moved up to reach the level 1.0566? It seems like it should be a sell.
Update: I understand now. The dates of the trade and my chart history are not always the same, so the trade was taken the previous day when it was a buy signal, which is why it hit the SL.
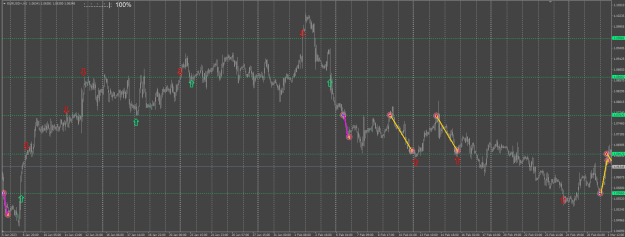
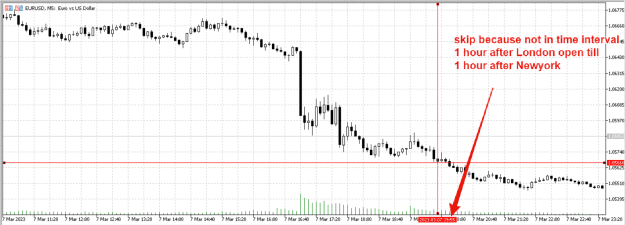
Also do you know why there are some trades that were not taken during this history? I've marked some of them with green and red arrows (green = potential buy, red = potential sell).
{image} I think I understand how the levels work. They are at a fixed distance of 100 pips but at any value that ends in 66 (for EURUSD)? In that case I wonder why the first trade in the list is a buy (2023-01-06) when price moved up to reach the level 1.0566? It seems like it should be a sell. Update: I understand now. The dates of the trade and my chart history are not always the same, so the trade was taken the previous day when it was a buy signal, which is why it hit the SL. Also do you know why there are some trades that were not taken during...
{image} I think I understand how the levels work. They are at a fixed distance of 100 pips but at any value that ends in 66 (for EURUSD)? In that case I wonder why the first trade in the list is a buy (2023-01-06) when price moved up to reach the level 1.0566? It seems like it should be a sell. Update: I understand now. The dates of the trade and my chart history are not always the same, so the trade was taken the previous day when it was a buy signal, which is why it hit the SL. Also do you know why there are some trades that were not taken during...
Ignored
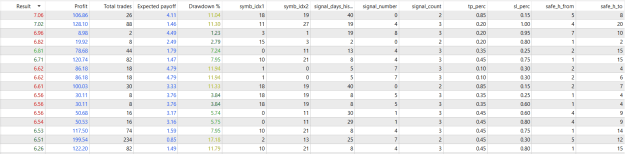
Some trades wont be taken at level if the previous Hi/Lo is not correct, strategy optimizes according to num of days hi/lo, signal number and signal count.. Stated on the first page
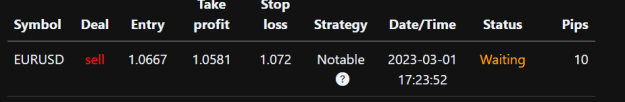
{image}Apologies if my questions are intrusive. I just want to understand. In this most recent signal, the entry was taken last week and would have exited profitably on 2022-03-02 ~18:00, I believe. Why is it status: waiting? Also it says pips: 10 but from 1.0667 to 1.0581 is ~86 pips.
Ignored
you provided an old screenshot.. i see date/time from March 1.. but the signal closed with TP on March 2.. refresh the page in the web browser maybe..
{quote} Some trades wont be taken at level if the previous Hi/Lo is not correct, strategy optimizes according to num of days hi/lo, signal number and signal count.. Stated on the first page
Ignored
right
and hi/lo is very important criteria because needed strong/long trend before bouncing from notable numbers (see charts for GBPUSD). days are different for each symbol. EURUSD only 2 days.. all the rest symbols need a lot more days for example AUDUSD even 42 days.
{quote} right and hi/lo is very important criteria because needed strong/long trend before bouncing from notable numbers (see charts for GBPUSD). days are different for each symbol. EURUSD only 2 days.. all the rest symbols need a lot more days for example AUDUSD even 42 days.
Ignored
I must have overlooked that.
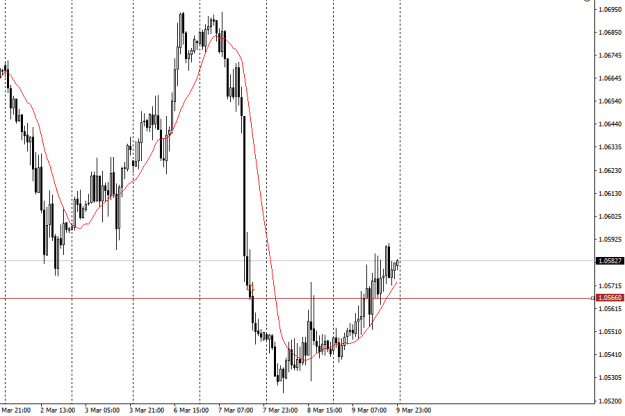
Is this the 'hi/lo' rule?
BUY when the previous 2 days high price is above our notable price level?
SELL when the previous 2 days low price is below our notable price level?
You see here that price reached the notable level of 1.0566. 2 days before both the high and the low were ABOVE this entry level. Is there a reason to reject this signal?
You see here that price reached the notable level of 1.0566. 2 days before both the high and the low were ABOVE this entry level. Is there a reason to reject this signal? EURUSD H1 {image}
Now working notable numbers signal EURCAD. For now 78 pips in profit but still 20 till target. Keep waiting maybe next week will reach. Are you patient?