No errors in the compile, I changed the color to Red, exited and restarted MT4, even removed and loaded sucessfully according to the journal. Black background. Also tried changing the color parameter.
is your candle time like mine or not ? here's the 4H charts :
Ignored
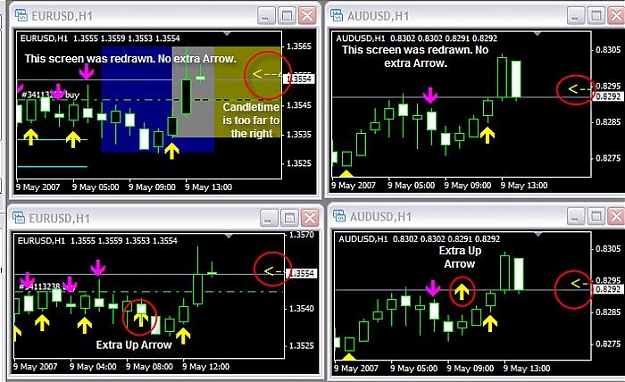
If I make my chart big enough, like 3/4 of the screen, then yes I can see the Candletime just fine. However, I have double monitors and I set up 2 rows by 8 columns of charts and monitor all major H4 charts at once (until I get a better feel for this indicator). Therefore each chart size is about 1/4 width of one monitor screen, and I can only see the "<--" of Candletime. The rest of the text (e.g. '89:14') is off-screen to the right.
Uh, I'm a Newbie (but I learn fast), so what's the best way to screen capture and crop a picture and add to it some descriptive info (text and arrows) ?
(By the way, when I started MT4 this morning, it placed a few extra TSS Arrows on some charts, on some older bars compared to Bar(0). A simple change of the timeframe and back clears them, e.g. H4 -> H1 -> H4. When I learn how to screen capture I will post a picture).
I too have problems with Candletime (and have since the beginning) getting it to display where I can see it. It tends to draw way too far to the right, so far that it cannot be seen at all! Even if I click on the MT4 Offset button for the chart, which shifts the bars left and displays a little more blank space to the right, the Candletime is still even farther to the right. I'm lucky if I see just a tip of the Candletime arrow. The only way I can see it fully is to click "-" to zoom out and then briefly I will see it, until the next tick which then auto-adjusts the window and bars again.
Any ideas? The problem, for me at least, is not the color but where it displays.
I'm new to MT4, and I'd also like to change some of the default colors for ALL my charts rather than one at a time. For example, I prefer green for rising bars rather than black, and red for falling bars rather than white. Maybe the answer is obvious in the documentation when I get around to it, but I haven't searched for it yet.
Thanks,
pips4life
Ignored
I have had the same problem. I do not normally have chart shift enabled. However by doing so, I am now able to see the candletime display. Maybe someone who is more familiar with code can tell us if there is a way to shift the display farther to the left. For now we can just enable chart shift to view the display time. Thank you for sharing your observations.
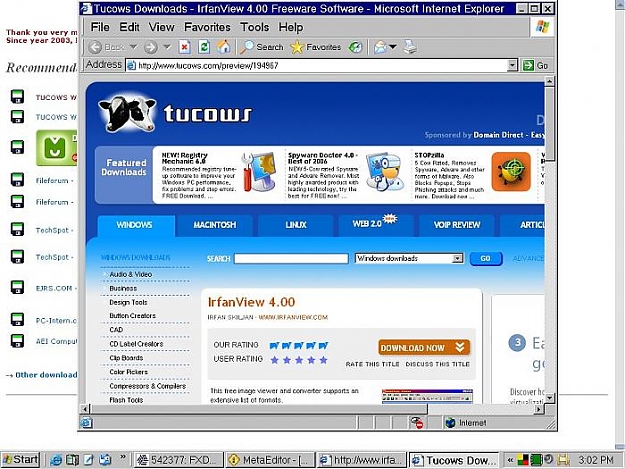
Thanks WHTenn for the SnagIt suggestion. I'll try the free trial for now. (Is there some free sreen capture program with similar features? SnagIt is apparently $40... no big deal. Earlier, I tried Function+Prt_Screen key which copied my screen to the clipboard, and then I used the free program Irfanview (an image viewer), but it doesn't seem to draw the circles and text as easily as SnagIt).
I'm posting a screen shot. Each chart size is about 1/4 width of one monitor screen, and I can only see the "<--" of Candletime. The rest of the text (e.g. '89:14') is off-screen to the right. If I make the chart 3/4 size, I can see all of Candletime.
To repeat what I said before, I started MT4 this morning, and it placed a few extra TSS Arrows on some charts, on some older bars compared to Bar(0). A simple change of the timeframe and back clears them, e.g. H4 -> H1 -> H4. I did another restart just now and the extra arrows do NOT occur, so I don't know how to reproduce this, only that it happened earlier today.
Anyone got problem on eur/usd Metatrader chart just now. Look my attachment below.. Please someone tell me how to fix it... TQ.
Ignored
You can go to Tools > History Center and edit that bar.
Thats what I would do. As long as its there you'll see a messed up chart everytime you scroll back to that area.
If I make my chart big enough, like 3/4 of the screen, then yes I can see the Candletime just fine. However, I have double monitors and I set up 2 rows by 8 columns of charts and monitor all major H4 charts at once (until I get a better feel for this indicator). Therefore each chart size is about 1/4 width of one monitor screen, and I can only see the "<--" of Candletime. The rest of the text (e.g. '89:14') is off-screen to the right.
Uh, I'm a Newbie (but I learn fast), so what's the best way to screen capture and crop a picture and add to it some descriptive info (text and arrows) ?
(By the way, when I started MT4 this morning, it placed a few extra TSS Arrows on some charts, on some older bars compared to Bar(0). A simple change of the timeframe and back clears them, e.g. H4 -> H1 -> H4. When I learn how to screen capture I will post a picture).
Pips4life
Ignored
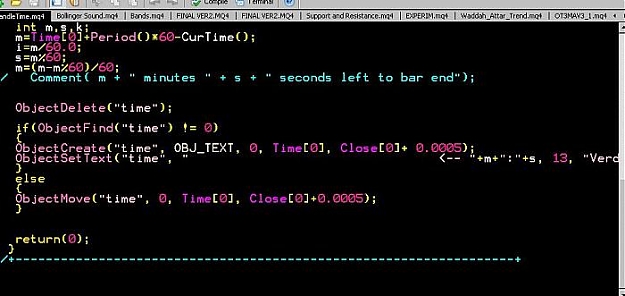
Hi pips, sorry to hear your candle time is not displaying properly. See the attachment. Before the <-- (TIME) there are many SPACES, remove some of those spaces and see if it helps. You can change The colour, Font face and Font all on the same line.
This is a very short program and its innards are bare, no tricky code here.
Hope this helps. Cheers,
Pip2
P.S. How to capture a screen. If you are using XP then OK otherwise I can't help, I know only XP and W98 (obsolete)
Press "PrtScrn" on your keyboard and the screen will be captured instantly in the windows "Clipbook". Next open any graphics software, I use "irfan", its free and it even plays videos. With your software open just paste the Clipbook image to the graphics software then crop, enlarge, reduce etc. to your hearts contents then save as a .jpg image. That's it. I usually place my screenshots on the deaktop and take is from there in a Browse window.
Thanks WHTenn for the SnagIt suggestion. I'll try the free trial for now. (Is there some free sreen capture program with similar features? SnagIt is apparently $40... no big deal. Earlier, I tried Function+Prt_Screen key which copied my screen to the clipboard, and then I used the free program Irfanview (an image viewer), but it doesn't seem to draw the circles and text as easily as SnagIt).
I'm posting a screen shot. Each chart size is about 1/4 width of one monitor screen, and I can only see the "<--" of Candletime. The rest of the text (e.g. '89:14') is off-screen to the right. If I make the chart 3/4 size, I can see all of Candletime.
To repeat what I said before, I started MT4 this morning, and it placed a few extra TSS Arrows on some charts, on some older bars compared to Bar(0). A simple change of the timeframe and back clears them, e.g. H4 -> H1 -> H4. I did another restart just now and the extra arrows do NOT occur, so I don't know how to reproduce this, only that it happened earlier today.
Pips4life
Ignored
Hi pips, no need to spend $40. Irfan is free on the web, just do a Google search and download and use it. I have been using it for several years. I use it to make my own icons or to change .jpg to .gif or png or tiff, or what have you. Its a very versatile program and it is entirely FREE!
Anyone got problem on eur/usd Metatrader chart just now. Look my attachment below.. Please someone tell me how to fix it... TQ.
Ignored
Seems like you have bad data. There seems to be nothing wrong with your screen. The problem is the long green line going South on your chart.
Metaquotes charts are "dynamic", meaning that you do not have to constantly scroll up and down to get current prices on the chart.
What has happened is that Metaquotes has shrunk the chart vertically so that you will ALWAYS get current prices on the screen.
To solve your problem of bad data, you will have to go to TOOLS then HISTORY CENTER, then click on the pair and TF in question and manually change the bad data. Change to anything reasonable e.g. duplicate the previous line. Save changes and you're in business.
Or you can just delete the offending line and your chart will be back as usual. If you dont do that, the chart will remain like that until the offending line goes off screen as time goes on.
I have had the same problem. I do not normally have chart shift enabled. However by doing so, I am now able to see the candletime display. Maybe someone who is more familiar with code can tell us if there is a way to shift the display farther to the left. For now we can just enable chart shift to view the display time. Thank you for sharing your observations.
regards
pippocket
Ignored
ChartShift and 15 spaces in the indicator seem to work for most zoom factors. Thanks for everyones help.
ChartShift and 15 spaces in the indicator seem to work for most zoom factors. Thanks for everyones help.
George
Ignored
Hi George,
Thanks for the suggestion to change Candletime spacing. I already use ChartShift, and I decided on 20 spaces in combination with 9-point font. The line in my code is now:
ObjectSetText("time", " <--"+m+":"+s, 9, "Verdana", Yellow);
It works great for all but the most narrow of Chart windows.
And to Snobol1,
Thanks for the tips on Irfan, but I guess you missed that I did already try that (a.k.a. "IrfanView"). I downloaded the latest today, and yes, it captures images, but am I missing something about drawing arrows, lines, circles, etc. with IrfanView? It doesn't seem to include any such capability, so I can't as easily add notations to the picture. The $40 SnagIt program does have this capability.
Is there another "free" Drawing/Art/Image-editing software someone can recommend? (Otherwise I'll probably spend the $40 for the added capabilities of SnagIt).
On GBP/USD 4 hr TF...buy arrow at the 4 GMT bar...coupled with divergence(CCI 14) at support was a good buy signal.(wish I would have taken it!).
My candle time doesn't show up either but I don't friggin care because I believe the arrows this is showing on the 4 hr TFs are really good signals that can be the basis for a great system with or without filters....
I would like to see some suggestions on SLs and targets strategies to maximize the full power of this indicator.
|
Joined Apr 2006
|
Status: Friss Die Haelfte
|110 Posts
I read this Thread several times today and am looking at the charts with the indicators on it. There has been some talk of the arrow appearing and disappearing during the candle being open.
I thought on this as I biked home and wondered about a MTF version.
eg. On the 4Hr you could paint an arrow of different colours from the 4 individual 1 Hr candles making up that bar. (The daily candle would need 6)
Red - 1st hour has a signal
Orange - 2nd hour has a signal
Yellow - 3rd hour has a signal
White - current hourly and 4 hour bar are getting a signal.
Does this make sense or am I mistaken? Would it work? Or even make it a Histogram in a separate window.
Thanks for the suggestion to change Candletime spacing. I already use ChartShift, and I decided on 20 spaces in combination with 9-point font. The line in my code is now:
ObjectSetText("time", " <--"+m+":"+s, 9, "Verdana", Yellow);
It works great for all but the most narrow of Chart windows.
And to Snobol1,
Thanks for the tips on Irfan, but I guess you missed that I did already try that (a.k.a. "IrfanView"). I downloaded the latest today, and yes, it captures images, but am I missing something about drawing arrows, lines, circles, etc. with IrfanView? It doesn't seem to include any such capability, so I can't as easily add notations to the picture. The $40 SnagIt program does have this capability.
Is there another "free" Drawing/Art/Image-editing software someone can recommend? (Otherwise I'll probably spend the $40 for the added capabilities of SnagIt).
Pips4life
Ignored
You give up so quickly my friend, free is beautiful. For circles text etc I just do that on the Meta platform and copy the screen already fixed up so irfan does not have to do that. Maybe there is another free program like Snagit at TuCows who knows. Poke around and am sure you'll find something.
I hate to part with my dollars, its in my nature.lol.
I read this Thread several times today and am looking at the charts with the indicators on it. There has been some talk of the arrow appearing and disappearing during the candle being open.
I thought on this as I biked home and wondered about a MTF version.
eg. On the 4Hr you could paint an arrow of different colours from the 4 individual 1 Hr candles making up that bar. (The daily candle would need 6)
Red - 1st hour has a signal
Orange - 2nd hour has a signal
Yellow - 3rd hour has a signal
White - current hourly and 4 hour bar are getting a signal.
Does this make sense or am I mistaken? Would it work? Or even make it a Histogram in a separate window.
Tossing out an Idea,
Labrat407
Ignored
Very good labrat, I think every idea is a good idea until proven otherwise. Different arrow colours will certainly complicate the code and maybe confuse the first time user and others who don't know what all the different colours mean. Candle Time gives a countdown to close of current candle. So it has the same effect.
I tend to shy away from separate window indicators, but that's just my own personal preference. I'll have to think about your idea a little more to see if there is a need for it. But the main thing is to keep on thinking and biking!!