The purpose of this thread is not to show off the way I trade.
The purpose is to make a challenge that current knowledge about market structure or mechanism is faulty and misleading.
Candlestick patterns and price action is useless and dangerous.
Current drawing horizontal lines extrapolated from previous high lows and assume them to be support and resistance is farcical.
Drawing angular lines assume a rate of change of price over time that's constant. What nonsensical assumption.
These are my opinion.
I put this out here on FF to draw awareness in retail traders community that you inherited these ideas from someone else. You readily accepted them without using your logical mind to question whether all these stuff make logical sense or not.
So why the title to this thread is intraday swing trade.
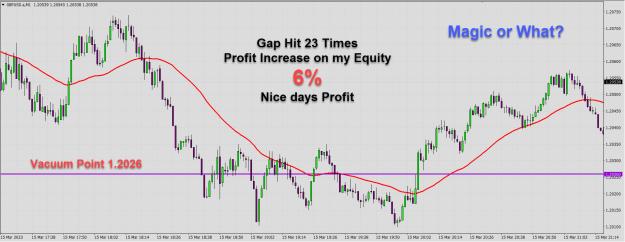
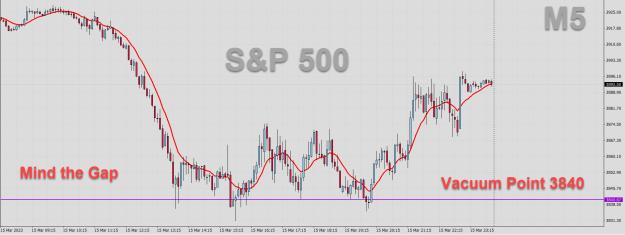
When you put on a requirement that the trades has to have a minimum of 50pips, you see the picture.
With all the usual technical analysis out there in the public domain, they can't be used to devise a trading strategy that can fulfil this requirement. This disconnect is, to ME, clear proof that support my opinion that I expressed above.
To me it's very simple, if you disagree with my opinion, demonstrate to me, even with hindsight history charts how you use candlestick patterns and price action, hh LL and whatever, to trade a minimum 50pips profit target per entry.
Don't get me wrong. I am not suggesting that 50pips per entry is a superior way to trade. Nope don't deflect my challenge. There are other ways that are profitable as well. There's no best way, BUT there are thousands of dumb ways to trade that's based on faulty knowledge.
I take aim at faulty, misleading and dangerous knowledge. Nothing to do with the way you trade. And not aimed at you as a trader.
50pips minimum profit intraday swing trade is the acid test that prove existing market structure knowledge is faulty and misleading. And traditional technical analysis is useless trash.
If you are already veteran in this business and still not profitable, I am telling you this is your problem. Don't let someone else tell you it's due to psychology that's why you fail. You need a shrink is bullshit. Or your lack of money management skill caused your failure. Nonsense.
I put my opinion on this thread. I know thousands of traders on FF use traditional technical analysis to trade. You disagree with me. Show us how you use traditional technical analysis to trade intraday swing trades minimum 50pips. Else my opinion stands true.
You can't be talking about market structure or mechanism if you can't relate that knowledge to this requirement. To me it's the usual big talk to show off you are knowledgeable. Again, I don't care about you as a person. I take aim at this faulty and misleading knowledge.
William, I don't think you have described this but can you please explain why you draw your support levels(blue zone) in the places that you do? thanks
Ignored
Hi shrips, I explain the charts I post on here.
1. Open lines -
h1 timeframe week open line and day open line.
M15 timeframe day open line and h4 open line.
M5 timeframe h4 open line and h1 open line.
M1 timeframe h1 open line and m15 open line.
2. Channel
H1 timeframe awr - average weekly range, and adr
M15 timeframe adr and ah4r- average h4 range
M5 timeframe ah4r and ah1r - average h1 range
M1 timeframe ah1r and am15r - average m15 range
3. Support level in bullish market. Resistance level in bearish market. Marked by blue box.
That's all I use. I don't impose any other assumptions onto the market.
You pointed to this blue box. It's not the support resistance from traditional technical analysis.
Every trading day the banks will indicate their intent whether to move price above or below this box. Most days are clear, some days can be volatile and not so clear.
GU yesterday's market is clear example. The market fell to bottom adr channel AFTER taking price below blue box in early London market.
GU market did not fall because your indicators tell you its oversold. Price action and candlestick patterns did not cause this fall. GU market did not fall because there's more supply then demand. GU market did not fall because there are huge sellers. GU market did not fall because they are after stop loss. GU market did not fall because it's a market manipulation.
GU market fell because, for whatever their reason, the banks decided to move price downwards. Period.
Our job as traders is to try find out as early as possible what this bank decision is for every trading day.
A direct answer to your question, a math equation.
I know people reading this will accuse me of marketing this math equation. Scammer.
Sorry, not for sale. If you insist to accuse me, then show proof that I sold it to someone. Don't accuse without proof.
Don't derail the message I try to bring to FF with false accusation.
Current market structure knowledge is faulty and traditional technical analysis is useless. Most traders are trading in blindness. This is the purpose of this thread.
From what I read on forum most traders scalp. This topic is about this specific segment, intraday swing trading. To me, a intraday swing trade has a minimum 50pips profit target. And the entry exit is on the same day. Why most traders scalp instead of swing trade intraday? Imo, there's zero trading strategy in this segment. If you disagree, pls point us to such strategy. Why I bring up this specific topic? Imo, the current market structure or some call it market mechanism knowledge is faulty. And outdated. I claim traders can only execute intraday...
Ignored
Hi BW, I'm glad to see you started your thread, and best wishes moving forward. I'll keep and eye on your progress. Take care and good trading (I've been in and out of the $J since the CS news hit last night -- wow!).
For today's market analysis - after yesterday's yen cross dramatic plunge, I notice a lot of signs that don't look normal for a lot of pairs. Major demarcation lines are crossed in quiet Asia session with persistent continuous intent. I expect huge volatility to follow later today. I propose to stay out of this market in early London, wait for New York session to get clearer picture. Cheers
Really.interested in your thread and so far enjoying your insights which have opened up a whole New perspective for me. But unfortunately it's left me.feeling everything most people know about trading ie technical analysis, price action, hh ll etc is out the window.. so where does that leave.the.average trader?
For today's market analysis - after yesterday's yen cross dramatic plunge, I notice a lot of signs that don't look normal for a lot of pairs. Major demarcation lines are crossed in quiet Asia session with persistent continuous intent. I expect huge volatility to follow later today. I propose to stay out of this market in early London, wait for New York session to get clearer picture. Cheers
Ignored
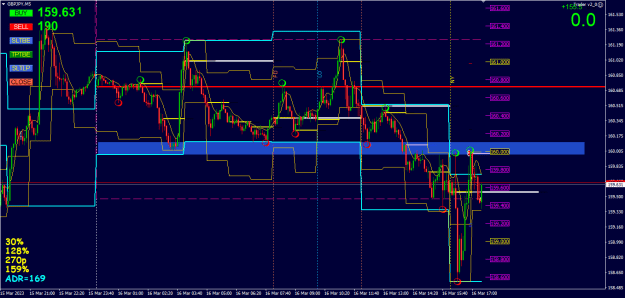
Waited for New York session to start trading, sell at the top of the demarcation box expecting the banks will not take price higher like the earlier swing. Cheers
Really.interested in your thread and so far enjoying your insights which have opened up a whole New perspective for me. But unfortunately it's left me.feeling everything most people know about trading ie technical analysis, price action, hh ll etc is out the window.. so where does that leave.the.average trader? I'm confused so what is best practice here ?
Ignored
Hi hope&glory, I have to deliver this reality on FF. I'm sure many of us who have traded for a few years with traditional TA agree with what I wrote. This thread is for members to post their views about this topic.
You ask "where does that leave.the.average trader?".
Nothing, that's why many traders are forced to continue with traditional TA until they quit altogether.
I wrote in the above post I have only 3 things on my chart that are logical and that I trust. There's nothing else I use to base my decision on. Take the same types of trades every day when I trade.
FF members don't like this reality I tell on forum. Say I fail as a TA trader. But if TA is any good why has no TA trader posted on this thread yet to demonstrate how to use TA to swing trade 50pips intraday, that we can use every trading day? Hard truth is difficult to accept, imo. Cheers
{quote} Waited for New York session to start trading, sell at the top of the demarcation box expecting the banks will not take price higher like the earlier swing. Cheers {image}
can Bollinger Bands be used to draw or determine demarcation zones?{quote}
Ignored
Hi angelofx, I use the upper and lower BB to mark the extreme boundary. Look at the demarcation zone(blue box) on my last chart. It's so clear AFTER the day progresses as price bounce off it many times. It's already there everyday, except traders don't see it. Banks will push price above or below it. I knew during Asia session there's going to be a lot of confusing crossovers, therefore I waited for New York session to trade. Cheers
{quote} Hi angelofx, I use the upper and lower BB to mark the extreme boundary. Look at the demarcation zone(blue box) on my last chart. It's so clear AFTER the day progresses as price bounce off it many times. It's already there everyday, except traders don't see it. Cheers
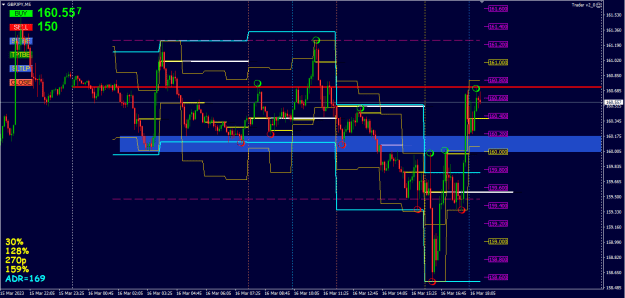
Update - see how banks push price above the demarcation zone(blue box) up to the dol at a rate above the ah4r top band(blue band). My question is, what TA explains for such market structure in live market which happen every trading day? Cheers {image}
Ignored
This is your way of deriving context /narrative BW
How do you enter your trades? What is your entry criteria?
If I may.
{quote} This is your way of deriving context /narrative BW How do you enter your trades? What is your entry criteria? If I may.
Ignored
Hi Rmg, I trade one way only. Bounce off support resistance in the direction of the trend. Minimum 50pips profit target.
Example GY new York session today, even when I see banks push price above demarcation zone(blue box). That means their intent is to push price higher I don't jump in blindly. I wait for pullback to support level to make entry. This can be a few hours later. Cheers
[quote=BWilliam;14363790]{quote} Hi Rmg, I trade one way only. Bounce off support resistance in the direction of the trend. Example GY new York session today, even when I see banks push price above demarcation zone(blue box). That means their intent is to push price higher I don't jump in blindly. I wait for pullback to support level to make entry. This can be a few hours later. Cheers[/quote
That is exactly using traditional technical analysis BW.
{quote} Hi Rmg, I trade one way only. Bounce off support resistance in the direction of the trend. Example GY new York session today, even when I see banks push price above demarcation zone(blue box). That means their intent is to push price higher I don't jump in blindly. I wait for pullback to support level to make entry. This can be a few hours later. Cheers[/quote That is exactly using traditional technical analysis BW.
Ignored
Hi, the difference is people don't know the real price target at 161.870 which the banks will push to in new York session right now. The earlier 2 pushes, one in Asia and one in London session will likely fail. Today I chose not to short the expected failed push in London session.
My point is extrapolating horizontal lines from previous high low and then assume them to be support and resistance is rubbish. I wrote my opinion in detail in my posts above. I bet nobody is aware banks push price up to their intended target in front of their eyes right now. Price action will not be able to tell this move that happens everyday. Cheers