AUD/USD and NZD/USD Face Key Hurdles, Downtrend Intact

AUD/USD is facing a strong resistance near the 0.6660 zone. NZD/USD is also struggling to clear the 0.5900 resistance zone.
Important Takeaways for AUD/USD and NZD/USD 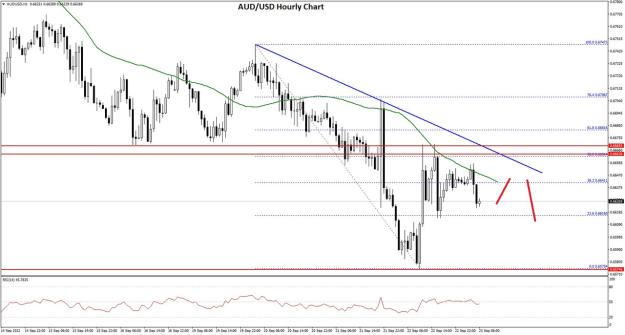
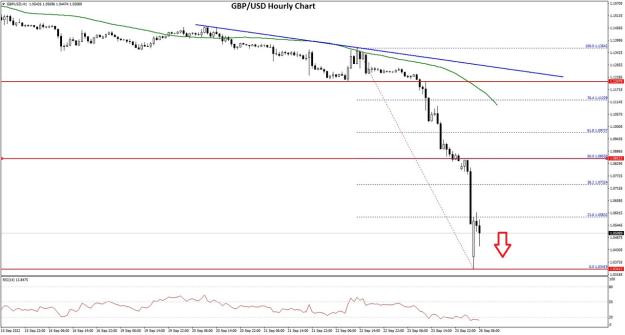
The bulls pushed the pair above the 38.2% Fib retracement level of the downward move from the 0.6747 swing high to 0.6575 swing low.
However, the bears remained active near the 0.6660 zone and the 50 hourly simple moving average. The pair failed to clear the 50% Fib retracement level of the downward move from the 0.6747 swing high to 0.6575 swing low.
There is also a key bearish trend line forming with resistance near 0.6650 on the hourly chart of AUD/USD. On the upside, the AUD/USD pair is facing resistance near the 0.6650 level.
The next major resistance is near the 0.6660 level. A close above the 0.6660 level could start a steady increase in the near term. The next major resistance could be 0.6720.
On the downside, an initial support is near the 0.6600 level. The next support could be the 0.6560 level. If there is a downside break below the 0.6560 support, the pair could extend its decline towards the 0.6500 level.
VIEW FULL ANALYSIS VISIT - FXOpen Blog...
Disclaimer: CFDs are complex instruments and come with a high risk of losing your money.
Attached Image (click to enlarge)
AUD/USD is facing a strong resistance near the 0.6660 zone. NZD/USD is also struggling to clear the 0.5900 resistance zone.
Important Takeaways for AUD/USD and NZD/USD
- The Aussie Dollar started a fresh decline from well above the 0.6700 zone against the US Dollar.
- There is a key bearish trend line forming with resistance near 0.6650 on the hourly chart of AUD/USD.
- NZD/USD started an upside correction from the 0.5800 support zone.
- There is a connecting bearish trend line forming with resistance near 0.5850 on the hourly chart of NZD/USD.
AUD/USD Technical Analysis
The Aussie Dollar failed to stay above the 0.6700 level and started a fresh decline against the US Dollar. The AUD/USD pair traded below the 0.6650 support zone to move into a bearish zone.
There was a clear move below the 0.6620 level and the 50 hourly simple moving average. The pair traded as low as 0.6575 on FXOpen and recently started an upside correction. There was a move above the 0.6620 level.
AUD/USD Hourly Chart
Attached Image (click to enlarge)
The bulls pushed the pair above the 38.2% Fib retracement level of the downward move from the 0.6747 swing high to 0.6575 swing low.
However, the bears remained active near the 0.6660 zone and the 50 hourly simple moving average. The pair failed to clear the 50% Fib retracement level of the downward move from the 0.6747 swing high to 0.6575 swing low.
There is also a key bearish trend line forming with resistance near 0.6650 on the hourly chart of AUD/USD. On the upside, the AUD/USD pair is facing resistance near the 0.6650 level.
The next major resistance is near the 0.6660 level. A close above the 0.6660 level could start a steady increase in the near term. The next major resistance could be 0.6720.
On the downside, an initial support is near the 0.6600 level. The next support could be the 0.6560 level. If there is a downside break below the 0.6560 support, the pair could extend its decline towards the 0.6500 level.
VIEW FULL ANALYSIS VISIT - FXOpen Blog...
Disclaimer: CFDs are complex instruments and come with a high risk of losing your money.
FXOpen - International True ECN Broker