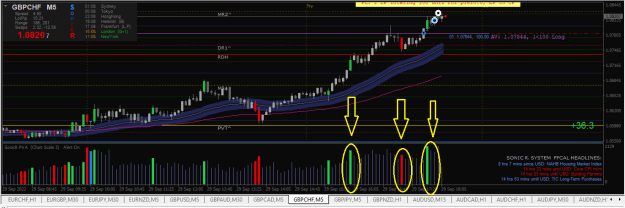
Disliked{quote} when I modify the color of that group the result is all the value areas completed or in process are the same. But, I think it is OK too, it hurts my eyes less. So I can work with the charts better like this than with the author's original method of 2 sophisticated colors in process thank you {image} {file}Ignored
I looked into more and it is using RGB ( Red,Green,Blue) and increase or decrease value based on timeframe and value.
It seems there are 6 colors assigned based on value.
if (step <= midvaidx)
{
if (giProfileTf == PERIOD_MN1) iclr +=1;
if (giProfileTf == PERIOD_W1) iclr +=2;
else iclr += 3;
}
else
{
if (giProfileTf == PERIOD_MN1) iclr -=1;
if (giProfileTf == PERIOD_W1) iclr -=2;
else iclr -= 3;
}
based on the condition, iClr is adding extra to RGB - causing color change.
If you really want to have different colors,
1) you can experiment with iclr value - which color is better by some other values, not just 1 ,2,3 and assign good number.
2) you can preassign some color of your choice ( 6 colors in this case for each case / Time Frame)