Wow ! This video certainly makes it easier to grasp Stacey's approach. Problem is spzd has given me even more homework now
But seriously though - these video's shorten the learning curve because the author explains things clearly, concisely and in easy to understand chunks.
{quote} Wow ! This video certainly makes it easier to grasp Stacey's approach. Problem is spzd has given me even more homework now But seriously though - these video's shorten the learning curve because the author explains things clearly, concisely and in easy to understand chunks.
Ignored
That video is a game changer. He has plenty. Should help shorten the curve.
Re the above video - I have tried , on Tradingview, to make Stacey Burke Levels on the SP500. I may have made a pigs ear of it.
Can anyone help please, especially if you use Tradingview?
Cheers.
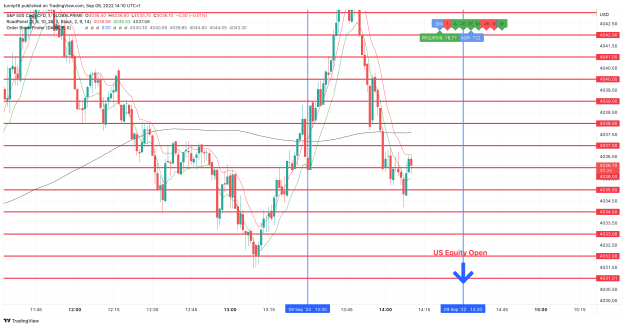
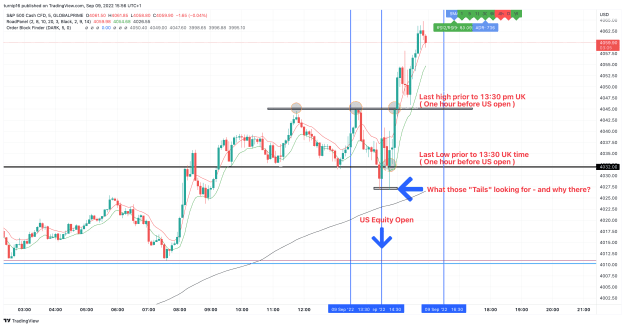
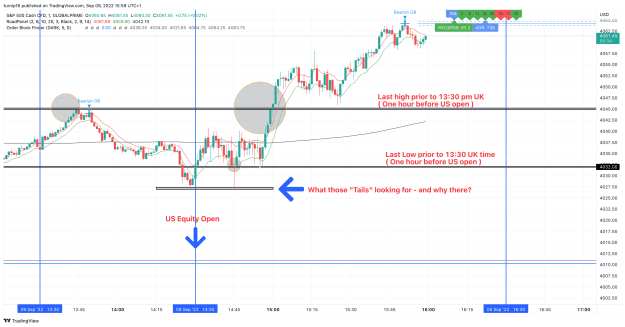
@spzd Re the above video - I have tried , on Tradingview, to make Stacey Burke Levels on the SP500. I may have made a pigs ear of it. Can anyone help please, especially if you use Tradingview? Cheers. {image}
Ignored
That's not quite it. I have looked and there are none that work right on indexes. I put horizontal lines at 00 and 50. ie 3900, 3950, 4000, 4050, 4100, 4150
This at least gives me some of the structure I want. Then I do like you and use a time line indi to auto place my session lines. There are also acceptable HOD/HOL indis.
My mes and mnq trading are on a hold until I am finish with the currencies (big FX test next week).
@spzd Re the above video - I have tried , on Tradingview, to make Stacey Burke Levels on the SP500. I may have made a pigs ear of it. Can anyone help please, especially if you use Tradingview? Cheers. {image}
Ignored
Nearly blinded by my horizontals so I have removed them and marked chart with prior high and lows. Added the one hour before US open and the US Equity open times.
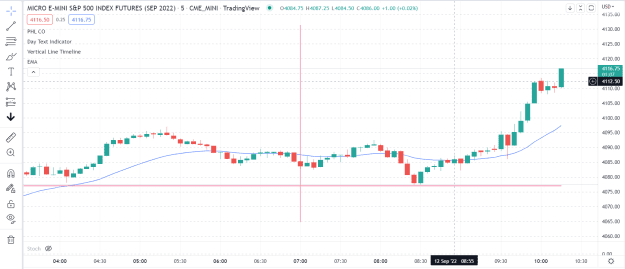
Usually use the 5 min for SP500 but also included the one minute chart for comparism.
Not sure why the "Tails" referred to by arrow are significant, unless I missed a level somewhere?
{quote} Nearly blinded by my horizontals so I have removed them and marked chart with prior high and lows. Added the one hour before US open and the US Equity open times. Usually use the 5 min for SP500 but also included the one minute chart for comparism. Not sure why the "Tails" referred to by arrow are significant, unless I missed a level somewhere? Hopefully this layout is kinder to the eyes {image} {image}
Ignored
Look to the left for the tails. Even then it does not always make sense.
{quote} Look to the left for the tails. Even then it does not always make sense. The lines, the lines .....
Ignored
"The lines"..........by an anonomous technical analyst inspired by the English bard
Speech: “Is this a (dagger) price level which I see before me.”
BY WILLIAM SHAKESPEARE (Sort of…)(from Macbeth, spoken by somebody else)
Is this a price level which I see before me,
The high toward my hand? Come, let me clutch thee.
I have thee not, and yet I see thee still.
Art thou not, fatal vision, sensible
To rising as to falling? or art thou but
A dagger line of the mind, a false creation,
Proceeding from the heat-oppressed brain?
I see thee yet, in form as palpable
As this which now I draw.
Thou marshall'st me the way that I was going;
And such a hidden level I was to use.
Mine eyes are made the fools o' the other senses,
Or else worth all the rest; I see thee still,
And on thy rise and fall gouts of sweat,
Which was not so before. There's no such thing:
It is the bloody business which informs trading,
Thus to mine eyes. Now o'er the one halfworld
Nature of price seems dead, and wicked dreams abuse
The curtain'd sleep; witchcraft celebrates
Pale Magee’s offerings, and wither'd pencil,
Alarmed by his sentinel, the price level wolf,
Who howl's his watch, thus with his stealthy pace.
With the trader’s ravishing numerical input, towards his screen
Moves like a ghost. Thou sure and firm-set algo,
Hear not my steps, which way they walk, for fear
Thy very levels prate of my profit whereabout,
And take the present pricing horror from the time,
Which now moves with it. While I sweat, he lives:
Words to the heat of rising levels too cold breath gives.
I go, and it is done; the bell invites me.
Hear it not, Duncan; for it is the opening bell
That summons thee to heaven or to hell.
My current trading style could easily be classified as scalper. So much so that I have my trade manager set to trade a set percentage of my account, take profit partial/final, move stop to BE, and start a trailing stop at a certain count. My approach is very methodical though. 3 basic 2 candle patterns for longs and 3 for shorts, at a specific time during the day. I pay little attention to the news, yet I am aware of it. When I have the workings of the weekly template understood I will incorporate that into the method. And just continue to learn.
And until all of the above is reached my plan allows me to focus on the entry patterns. Which is not that much work. I have been analyzing these entries going back about 3 months and the results are pretty damn good.
Once I took that poorly thought out trip down indicator hell, I convinced myself "old school" was a just that old. As time went on I began to realize that Price Action of some type was the real way. Now I am ready to take the basics of PA and jump back in the fray.
My current trading style could easily be classified as scalper. So much so that I have my trade manager set to trade a set percentage of my account, take profit partial/final, move stop to BE, and start a trailing stop at a certain count. My approach is very methodical though. 3 basic 2 candle patterns for longs and 3 for shorts, at a specific time during the day. I pay little attention to the news, yet I am aware of it. When I have the workings of the weekly template understood I will incorporate that into the method. And just continue to learn....
Ignored
You got it Mark! Time/Price/Levels and then the subcategories of each.
Day counts will come like turning on a lightbulb at some point ;...
Look at a guy like Tom Hougaard..makes a heck of a lot of money all by trading classical chart patterns mainly.DTs DBs measured moves..candle patterns...and timing ..selling.on close etc.
All of these are in some way utilized by SB... Old.is best IMO.. and it in itself is like a lightbulb moment when we come to that simplicity point. Liberating when you realize you don't need MAs Stochastics MACD RSi Volume etc... Only some lines.
{quote} You got it Mark! Time/Price/Levels and then the subcategories of each. Day counts will come like turning on a lightbulb at some point ;... Look at a guy like Tom Hougaard..makes a heck of a lot of money all by trading classical chart patterns mainly.DTs DBs measured moves..candle patterns...and timing ..selling.on close etc. All of these are in some way utilized by SB... Old.is best IMO.. and it in itself is like a lightbulb moment when we come to that simplicity point. Liberating when you realize you don't need MAs Stochastics MACD RSi...
Ignored
Great journal with interesting ideas that chime with my own journey.
When a market goes sideways underneath a high it is going to explode vertically. When a market goes sideways above a low it is going to explode vertically. An American (US) holiday on a Monday or Friday will lead to big moves that week. Lock in the money, get off the screen. https://www.youtube.com/watch?v=KL13aR3mhes SB hits new levels in this video. I am liking the more in your face style.
Ignored
In this video Burke gives reference to The Quarters Theory. He mentioned hitting a 1000 level.
His day trading box is 100 pips broken down into increments of 25. Nothing new here, but interesting how many methods all use similar techniques.
And trading the mes (S&P 500 micro index) is the main reason I am studying Volman (and maybe in time go back to Brooks).
Trading futures equities can be quite profitable looking at it in hindsight and reading other's posts. I have been doing some trading in this and when you are right it is a good day. Need to get to the point of consistent profitability (easier said than done?).