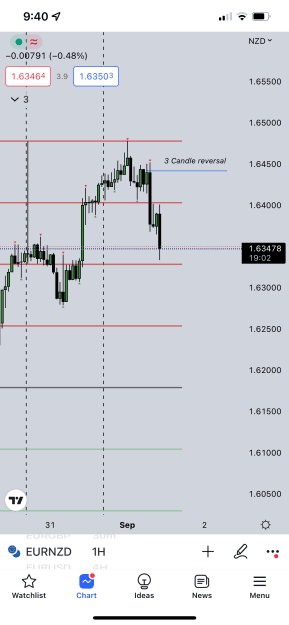
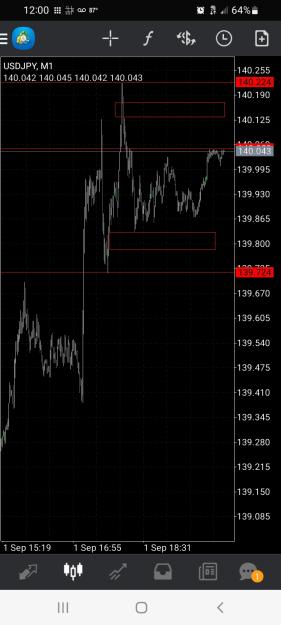
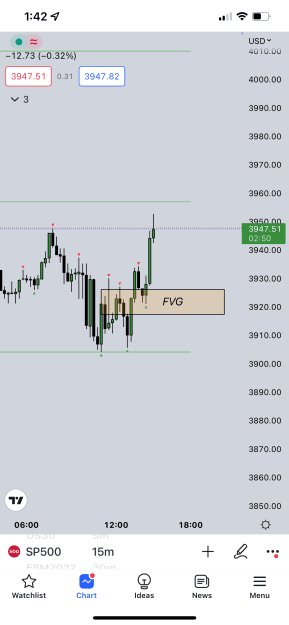
Your last chart. Why did the FVG around 1.6400 ( the two up green candles and the black candle marked by red spot) fail for a long,
yet your posted FVG - same chart - worked out?
Your last chart. Why did the FVG around 1.6400 ( the two up green candles and the black candle marked by red spot) fail for a long, yet your posted FVG - same chart - worked out?
Ignored
Not sure of your question but here is the reason
could have took a short trade.
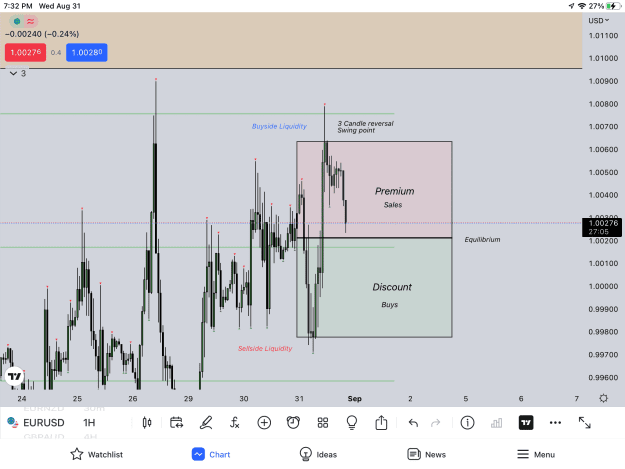
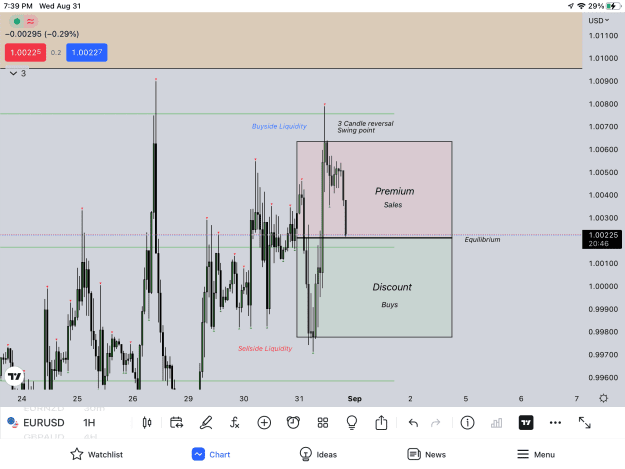
{quote} Not sure of your question but here is the reason could have took a short trade. {image} {image} {image}
Ignored
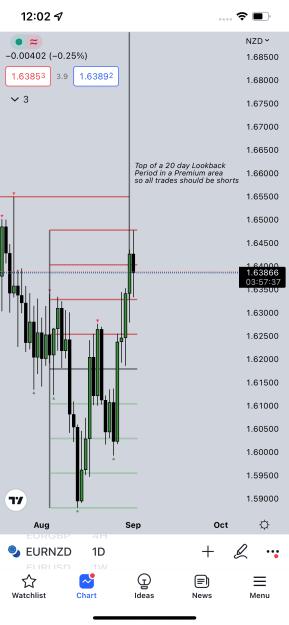
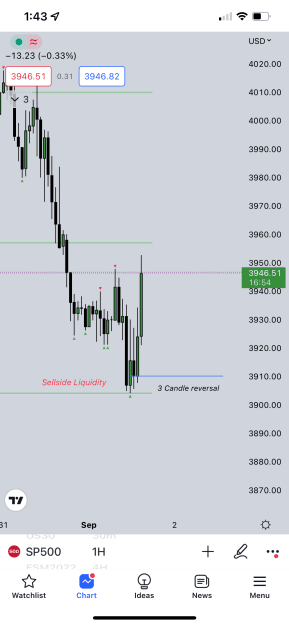
No -Three red triangles (over a high bar )fractal?) from the RIGHT is a high bar around1.6400. There is a FVG there -trading that FVG long would be a fail?
(Two red markers from the right is another high of a FVG for a short trigger that wanders sideways?
{quote} No -Three red triangles (over a high bar )fractal?) from the RIGHT is a high bar around1.6400. There is a FVG there -trading that FVG long would be a fail? (Two red markers from the right is another high of a FVG for a short trigger that wanders sideways?
Ignored
Ok I think I see and understand your question
1.)FVG’s can fail
2.) Order blocks can fail
When doing your analysis on the beginning
of this trade the consensus of the higher timeframe
is to take only short trades no longs.We were coming
down from a Premium area.
Yes you could risk trying to trade pullbacks
But that would be considered a low risk trade
Why do that when your analysis is to trade short.
{quote} Ok I think I see and understand your question 1.)FVG’s can fail 2.) Order blocks can fail When doing your analysis on the beginning of this trade the consensus of the higher timeframe is to take only short trades no longs.We were coming down from a Premium area. Yes you could risk trying to trade pullbacks But that would be considered a low risk trade Why do that when your analysis is to trade short.
Ignored
Thanks FH. Very helpful comments regarding looking at a bigger picture to begin with