Hello family,
I would like to share 6 graphics but all H1.
I want to explain here about the 6 graphics.
My markings are made from the minimum magnification of the graph to the maximum magnification. So from minimum to maximum are 6 steps, I hope I was clear.
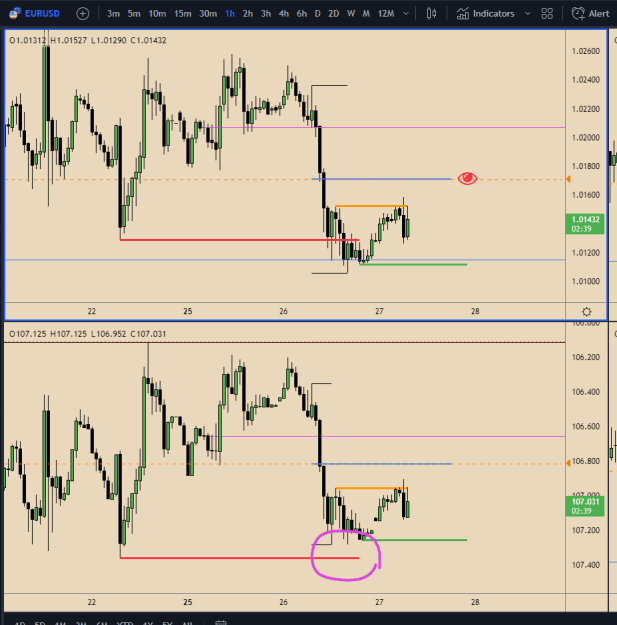
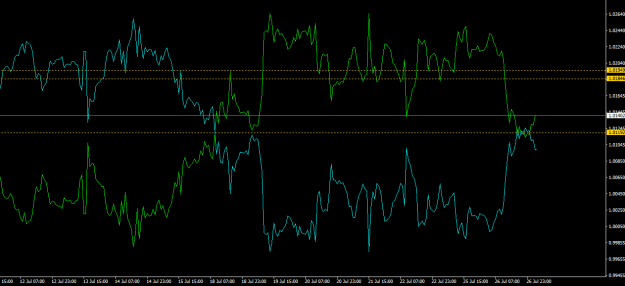
Note where the level points are where the market always catches up.
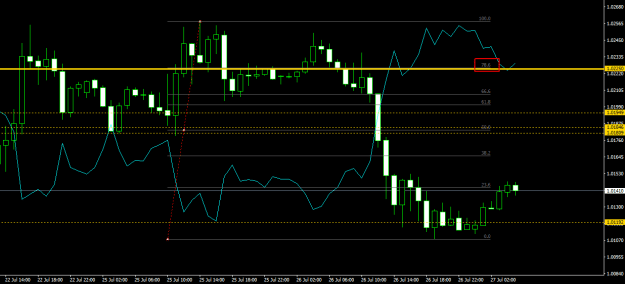
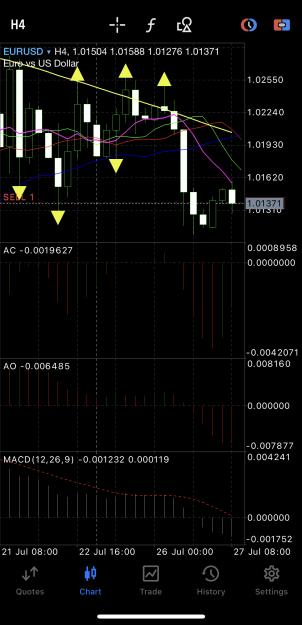
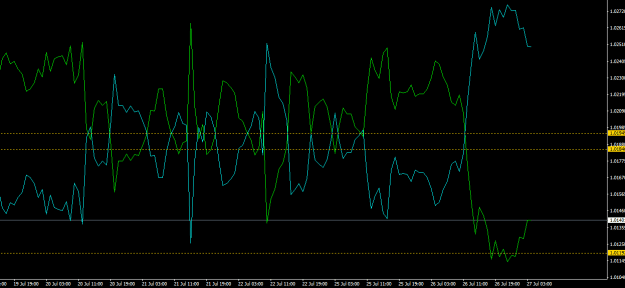
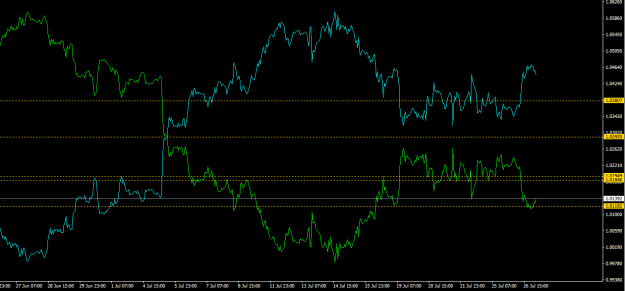
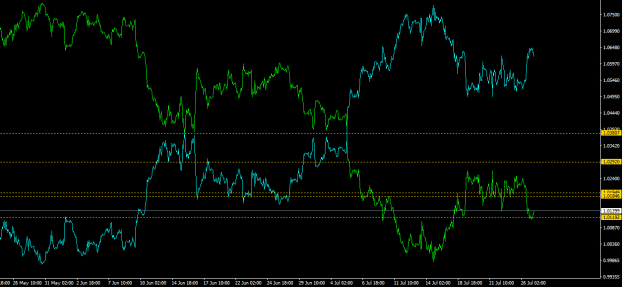
I mean: the crosses between blue line and green line (green line is the main one).
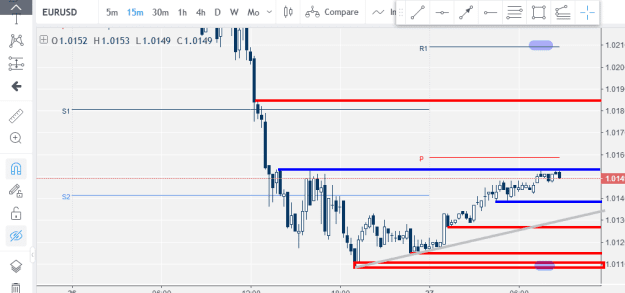
(6) First graph is at maximum magnification.
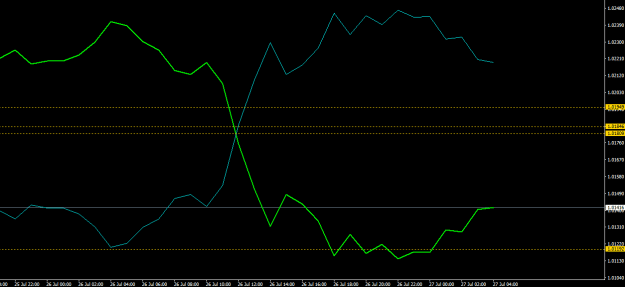
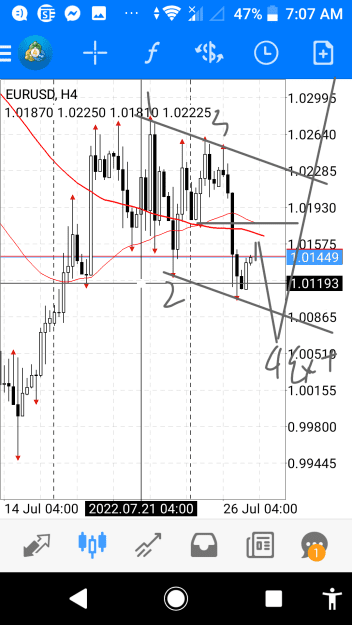
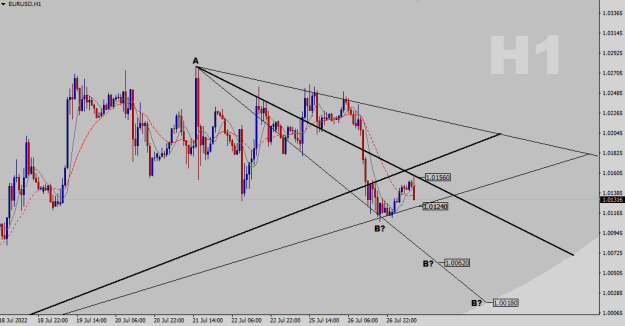
(5)
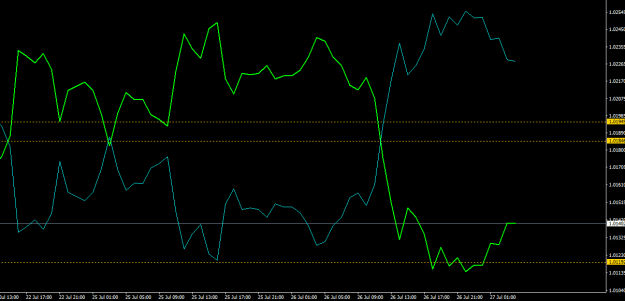
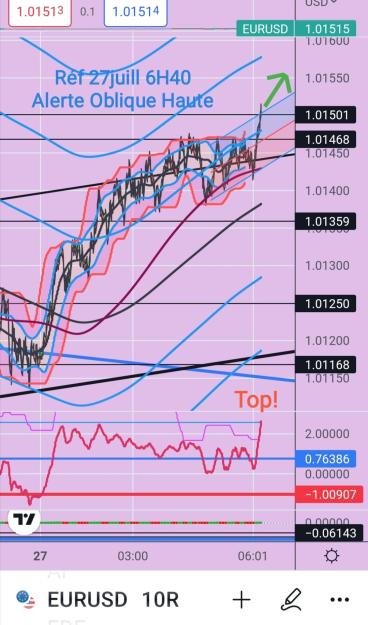
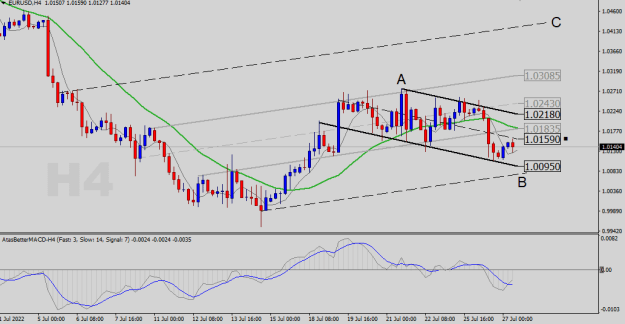
(4)
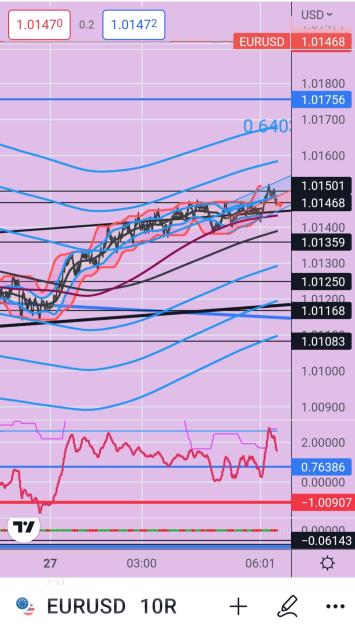
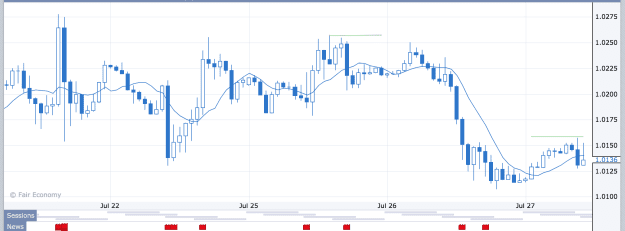
(3)
(2)
(1) Minimum magnification
These are my markings for the H1 chart.
I would like to share 6 graphics but all H1.
I want to explain here about the 6 graphics.
My markings are made from the minimum magnification of the graph to the maximum magnification. So from minimum to maximum are 6 steps, I hope I was clear.
Note where the level points are where the market always catches up.
I mean: the crosses between blue line and green line (green line is the main one).
(6) First graph is at maximum magnification.
Attached Image (click to enlarge)
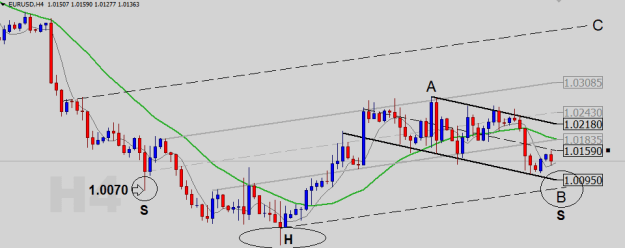
(5)
Attached Image (click to enlarge)
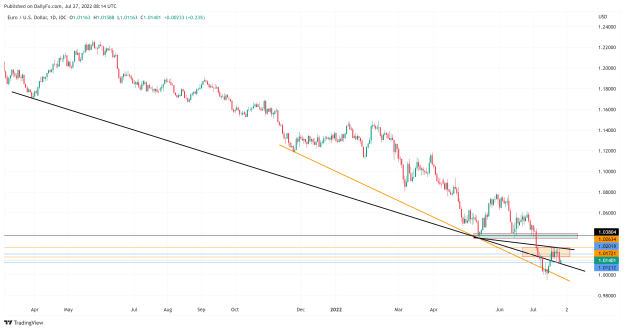
(4)
Attached Image (click to enlarge)
(3)
Attached Image (click to enlarge)
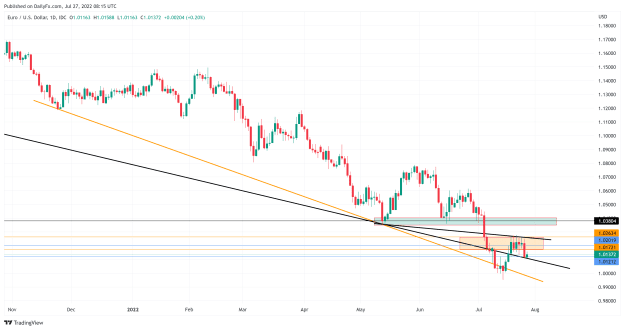
(2)
Attached Image (click to enlarge)
(1) Minimum magnification
Attached Image (click to enlarge)
These are my markings for the H1 chart.
"No pain no gain"
1