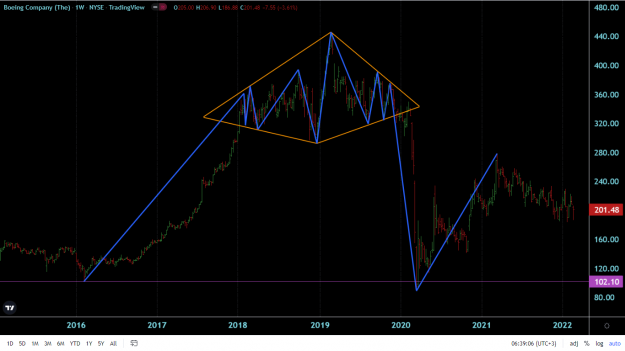
now let's what had happened to the Boeing Company (BA) chart... the second one first picture displays how the actual diamond got developed eventually....
the second one shows the whole history of a single-diagonal diamond being developed on the BA charts and how it then reached its MOT (measured objective target) after exiting that formation... MOT was located at 102.10 level and had to be reached after the price exited that reversal diamond...
the second one shows the whole history of a single-diagonal diamond being developed on the BA charts and how it then reached its MOT (measured objective target) after exiting that formation... MOT was located at 102.10 level and had to be reached after the price exited that reversal diamond...
Attached Image(s) (click to enlarge)
1