{quote} Thanks How you deal with a situation like that? Sell/Buy or nothing It's definitely overstretched because is falling for most of the year now.
Ignored
You're welcome.
I don't trade euro so I wouldn't know exactly what to say. And of course it's all relative to what timeframe you're using. In both charts we see strong downtrend and price is trading below the lower limit of envelope 256. What I'd do is wait for a pullback and enter short for continuation. But of course you need a signal because price can and mostly will move towards its mean (center line).
{quote} You're welcome. I don't trade euro so I wouldn't know exactly what to say. And of course it's all relative to what timeframe you're using. In both charts we see strong downtrend and price is trading below the lower limit of envelope 256. What I'd do is wait for a pullback and enter short for continuation. But of course you need a signal because price can and mostly will move towards its mean (center line).
I strongly encourage new traders here to first try and experiment with envelopes before you move on to other stuff. There's a reason this thread starts with envelopes.
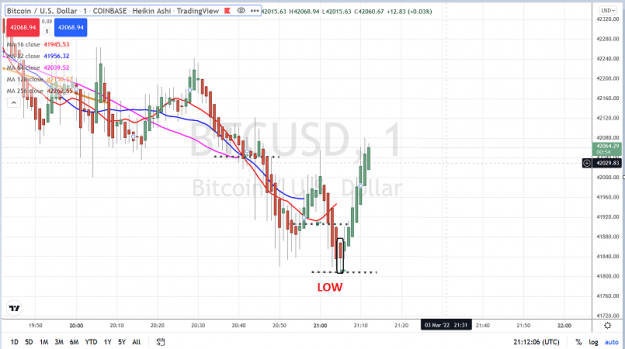
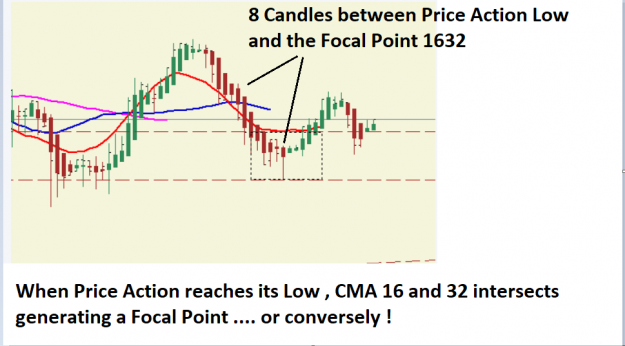
- between the Price Action Low and the Centered Moving Average 16 (red) Low when it turns Up (7/8 HA Candles)
- between the Price Action Low and the Centered Moving Average 32 (blue) Low when it turns Up ( 16 HA Candles)
- between the Price Action Low and the Centered Moving Average 64 (red) Low when it crosses the Focal Point build by the CMA 16 and 32 ( 32 HA Candles)
Do you understand how a Focal Point is build and what it means when a Centered oving Average turns Up (or Down)
EXERCICE dDo yourself your manual work , do your homework; Count yourself the number of HA Candles - between the Price Action Low and the Centered Moving Average 16 (red) Low when it turns Up (7/8 HA Candles) - between the Price Action Low and the Centered Moving Average 32 (blue) Low when it turns Up ( 16 HA Candles) - between the Price Action Low and the Centered Moving Average 64 (red) Low when it crosses the Focal Point build by the CMA 16 and 32 ( 32 HA Candles) Do you understand how a Focal Point is build and what it means when a Centered...
Ignored
Hi parisboy. Welcome back and thanks for the educational posts.
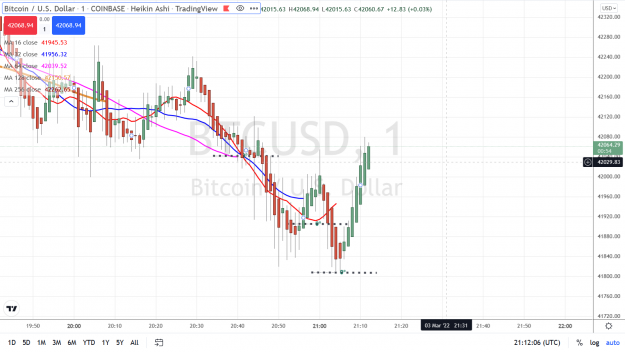
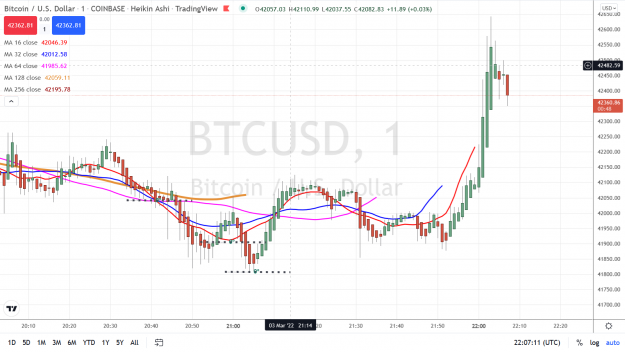
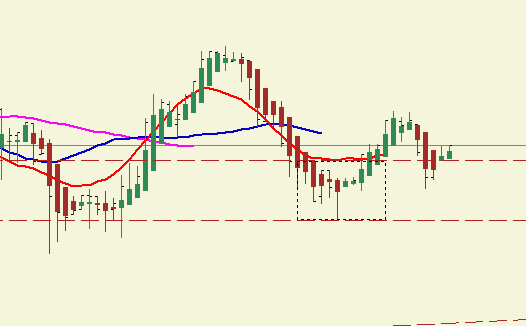
I think I understand what candles you mean for example between cma 16 low and price action low. You mean the number of candles in the square in this picture?
Attached Image
I think I get it that's what justifies the shift backs of the CMAs. But how does it help the trader? Could you elaborate more?
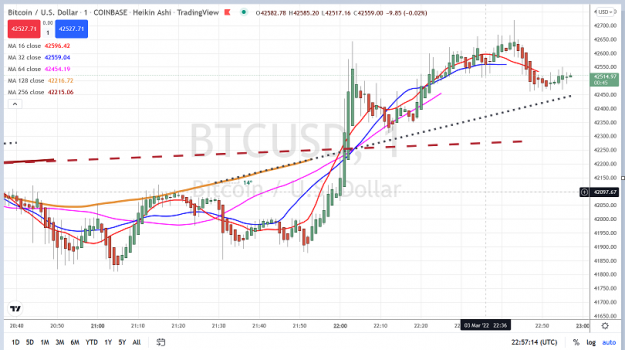
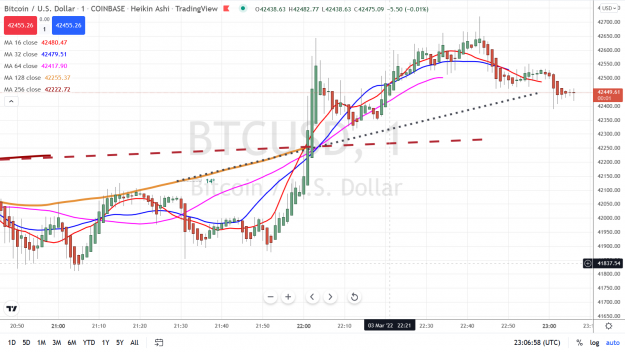
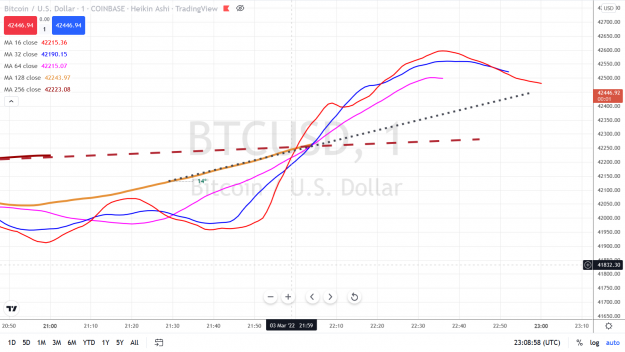
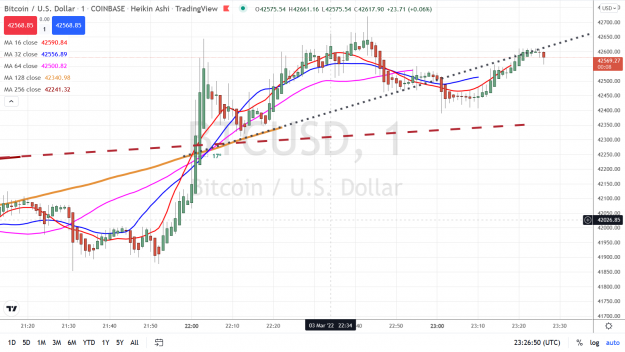
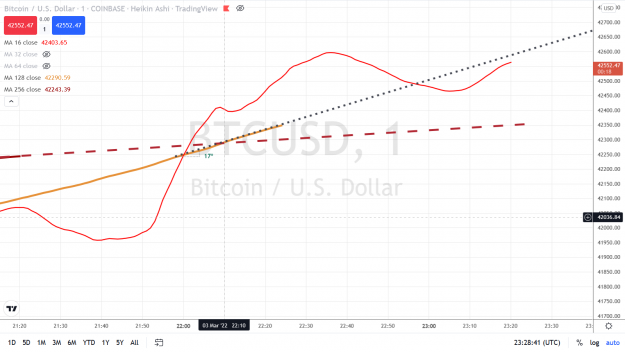
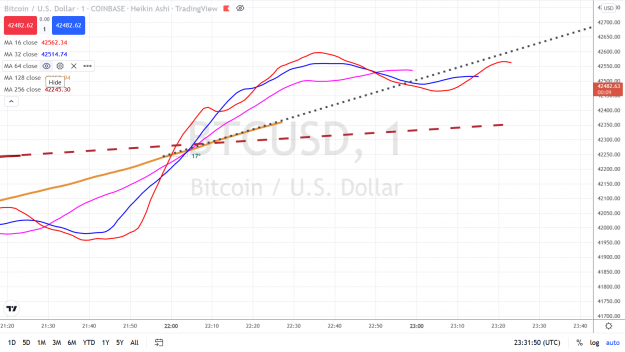
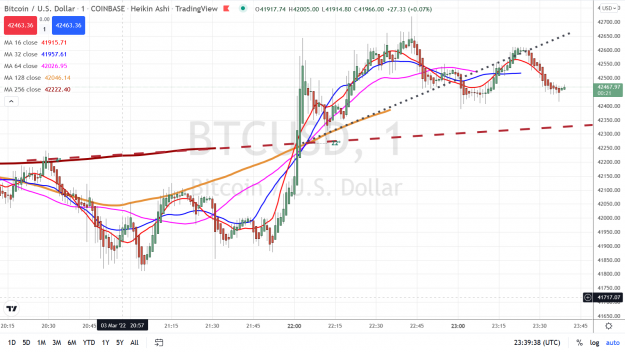
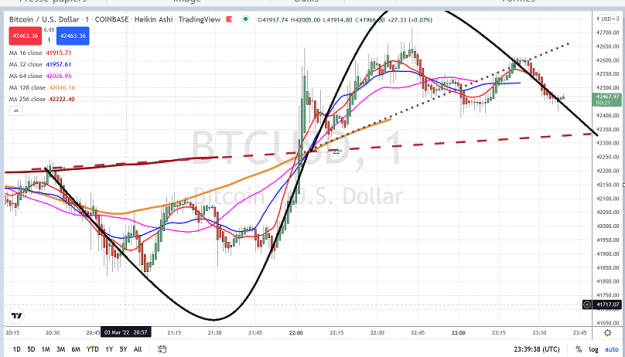
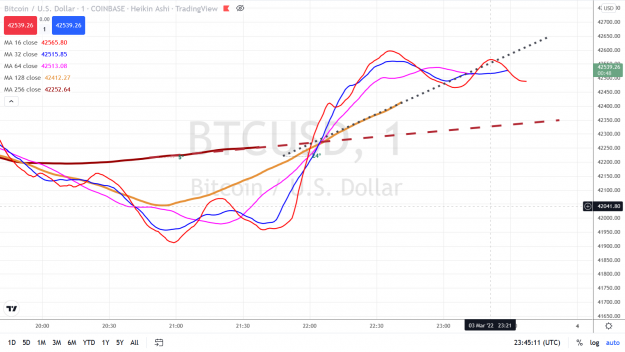
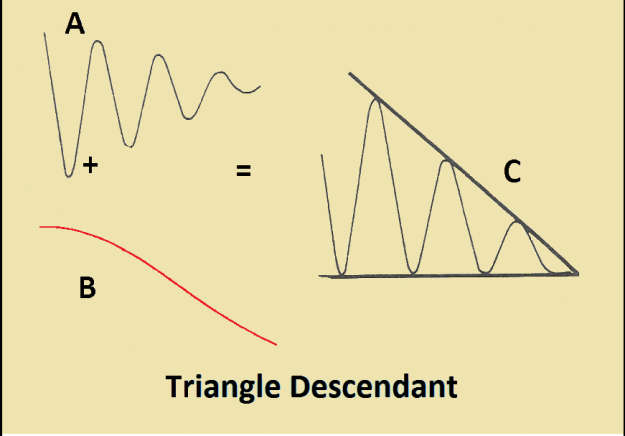
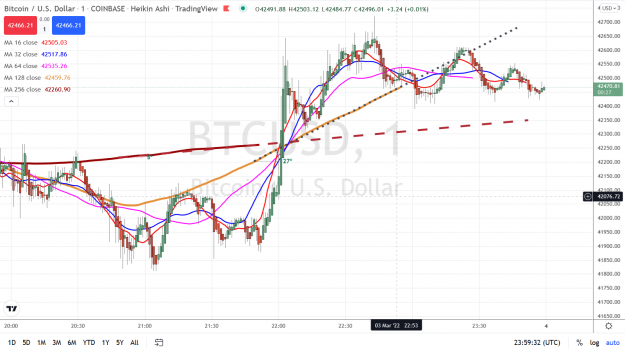
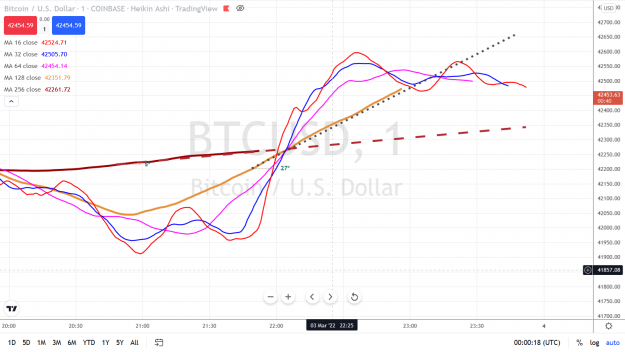
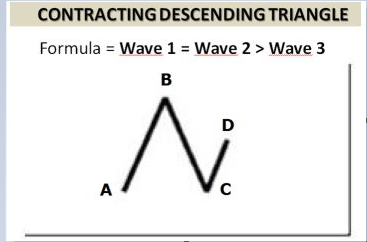
Follow up do you see the Trend ? do you see the Sinewave(s) oscillating around the Trend ? {image} {image} {image}
Ignored
What I've learned so far is that I think shorter time sinewaves oscillate around the 128 CMA, but the longer time sinewave the bigger picture oscillates around the 256 cma.
{quote} Hi parisboy. Welcome back and thanks for the educational posts. I think I understand what candles you mean for example between cma 16 low and price action low. You mean the number of candles in the square in this picture? {image} I think I get it that's what justifies the shift backs of the CMAs. But how does it help the trader? Could you elaborate more?