Introduction
Most Expert Advisors have one or more parameters that affect its behavior. Most trading platforms offer functionality to "optimize" these parameters over a given date range. The goal is to search for the best parameters of which we believe it remains profitable for while even after the backtest date range. The question however is: "How can we select the most robust setting from our backtest results?". Robust meaning here: most likely to also be profitable in the near future.
Simply selecting the most profitable parameters from a backtest is not a good idea. They are often not the most robust parameters, as these were most likely the result of a few "lucky" trades. So which parameters should we choose? Choose the 90th-percentile most profitable parameters? Look at Sharpe? Some combination of parameters?
Example
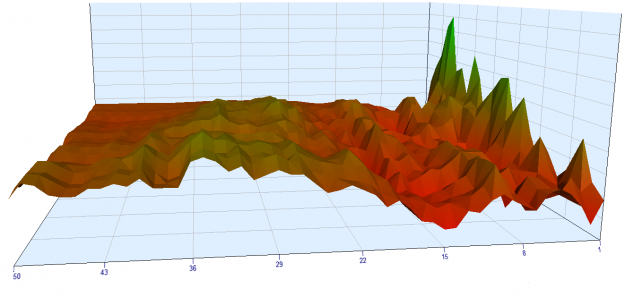
As an example to try out some ideas, lets consider a very simple breakout strategy for MetaTrader 5. This Expert Advisor only has two parameters. If we try all combinations of the parameter values and backtest over a 6 month date range, we get the following profits:
Using these same parameters for the following 2 months, gives the following profits:
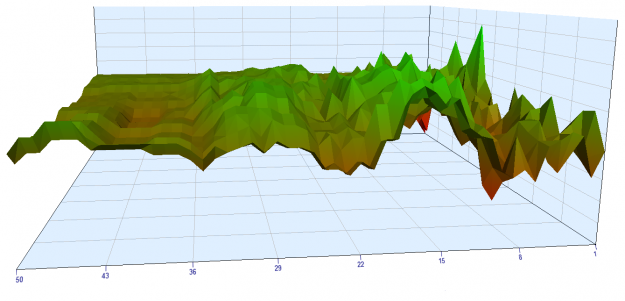
(the 6 month backtest interval obviously had higher profits than the 2 month forward test interval, but somehow MetaTrader chose weird red/green colors)
Looking at the backtest, the plateau around parameter value 30 looks nice and stable, and values around 15 are to be avoided. In the forward test the plateau turned out to be a good choice, but surprisingly value 15 would have been a very good choice!
In both graphs the highest profits can be found at the upper righthand side, but the chaotic nature clearly shows these are mere luck and certainly not stable, robust settings. We can look at it another way by sorting the profits and creating a profit distribution:
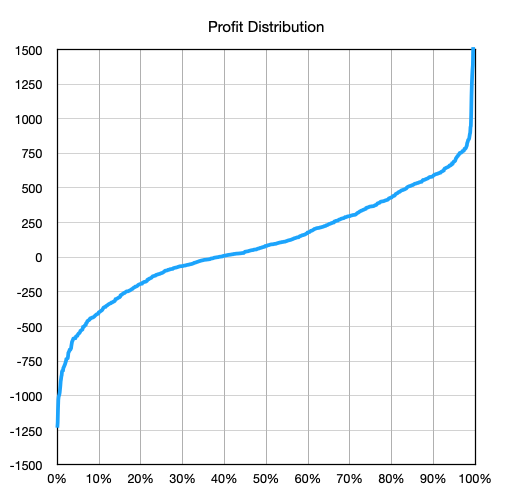
In my opinion, the excessive rise of the profits at the righthand side is a sign that the corresponding parameters were just "lucky". Similarly, the lefthand side was just unlucky. Personally I avoid the parameter settings outside the 10th- to 90th-percentile interval as these are probably not robust in future markets. What do you think?
It is reassuring to see that more than 63% of the possible parameter values resulted in profit. The strategy is clearly profitable, but how do we tune the parameters?
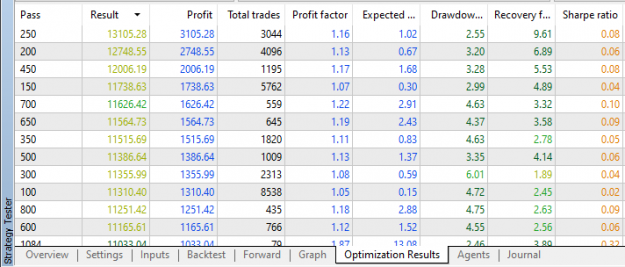
Can we perhaps use the various metrics provided by the MetaTrader Strategy Tester software?
In the following graphs, I plotted the profits during the backtest interval versus the various metrics:
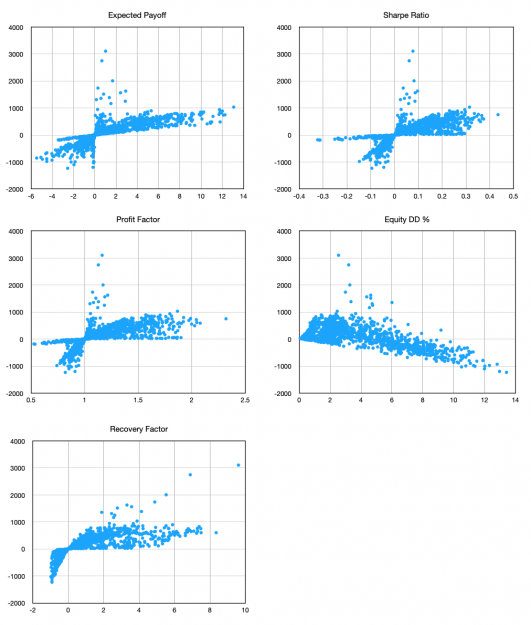
These graphs look reasonable (e.g. higher Sharpe Ratio is higher profits).
Now see what happens if we plot the profits during the forward test interval versus the metrics of the backtest interval (note that the backtest interval is 6 months, and the forward test interval 2 months, hence the profits are lower):
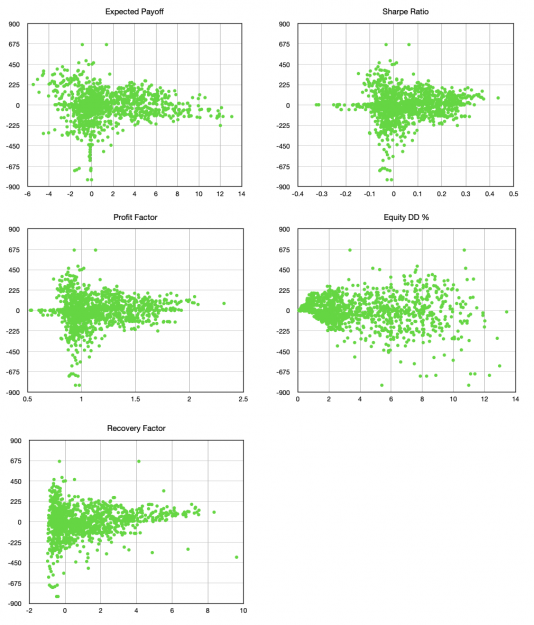
There is almost no connection between the metrics and the profit in these point clouds. For clarity, here we overlay both graphs:
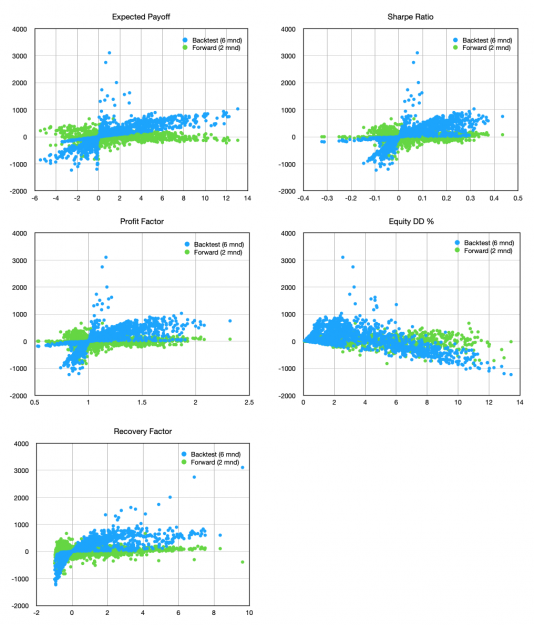
How can we possibly select the best parameters based on the backtest metrics?
Most Expert Advisors have one or more parameters that affect its behavior. Most trading platforms offer functionality to "optimize" these parameters over a given date range. The goal is to search for the best parameters of which we believe it remains profitable for while even after the backtest date range. The question however is: "How can we select the most robust setting from our backtest results?". Robust meaning here: most likely to also be profitable in the near future.
Simply selecting the most profitable parameters from a backtest is not a good idea. They are often not the most robust parameters, as these were most likely the result of a few "lucky" trades. So which parameters should we choose? Choose the 90th-percentile most profitable parameters? Look at Sharpe? Some combination of parameters?
Example
As an example to try out some ideas, lets consider a very simple breakout strategy for MetaTrader 5. This Expert Advisor only has two parameters. If we try all combinations of the parameter values and backtest over a 6 month date range, we get the following profits:
Attached Image (click to enlarge)
Using these same parameters for the following 2 months, gives the following profits:
Attached Image (click to enlarge)
(the 6 month backtest interval obviously had higher profits than the 2 month forward test interval, but somehow MetaTrader chose weird red/green colors)
Looking at the backtest, the plateau around parameter value 30 looks nice and stable, and values around 15 are to be avoided. In the forward test the plateau turned out to be a good choice, but surprisingly value 15 would have been a very good choice!
In both graphs the highest profits can be found at the upper righthand side, but the chaotic nature clearly shows these are mere luck and certainly not stable, robust settings. We can look at it another way by sorting the profits and creating a profit distribution:
Attached Image
In my opinion, the excessive rise of the profits at the righthand side is a sign that the corresponding parameters were just "lucky". Similarly, the lefthand side was just unlucky. Personally I avoid the parameter settings outside the 10th- to 90th-percentile interval as these are probably not robust in future markets. What do you think?
It is reassuring to see that more than 63% of the possible parameter values resulted in profit. The strategy is clearly profitable, but how do we tune the parameters?
Can we perhaps use the various metrics provided by the MetaTrader Strategy Tester software?
Attached Image (click to enlarge)
In the following graphs, I plotted the profits during the backtest interval versus the various metrics:
Attached Image (click to enlarge)
These graphs look reasonable (e.g. higher Sharpe Ratio is higher profits).
Now see what happens if we plot the profits during the forward test interval versus the metrics of the backtest interval (note that the backtest interval is 6 months, and the forward test interval 2 months, hence the profits are lower):
Attached Image (click to enlarge)
There is almost no connection between the metrics and the profit in these point clouds. For clarity, here we overlay both graphs:
Attached Image (click to enlarge)
How can we possibly select the best parameters based on the backtest metrics?