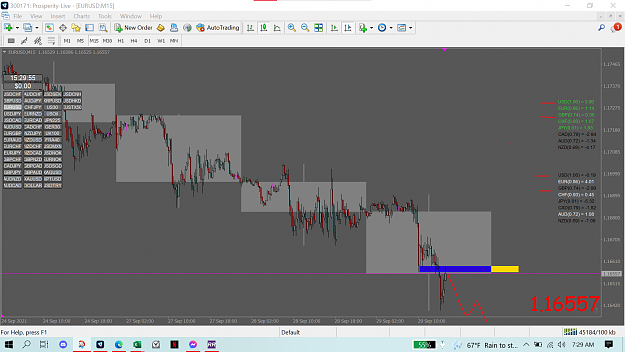
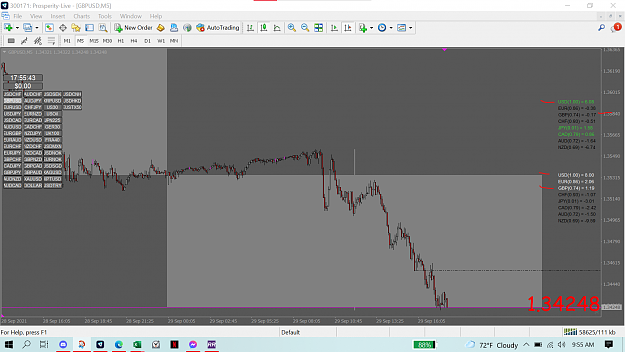
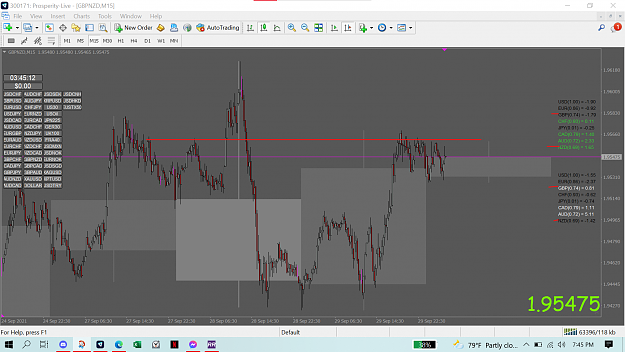
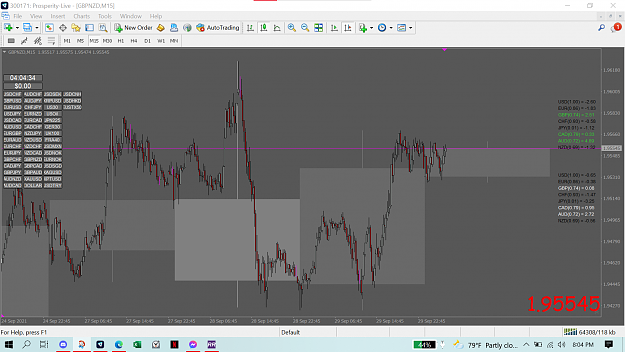
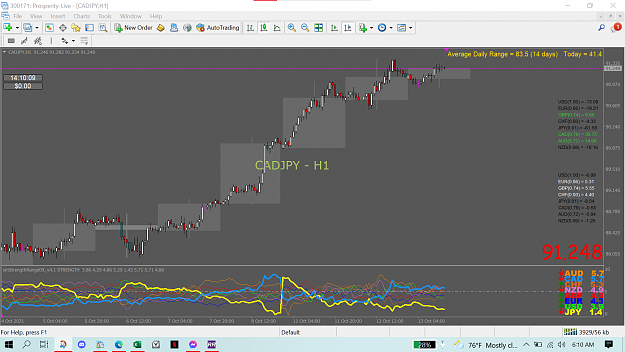
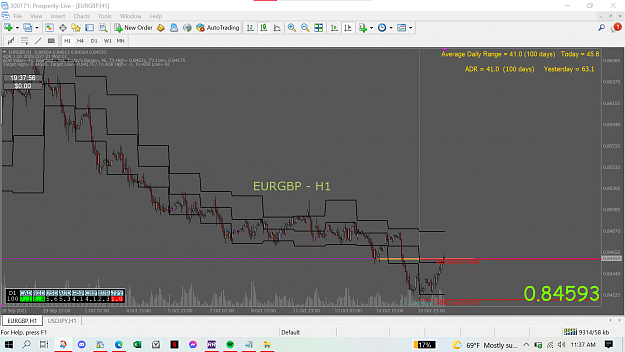
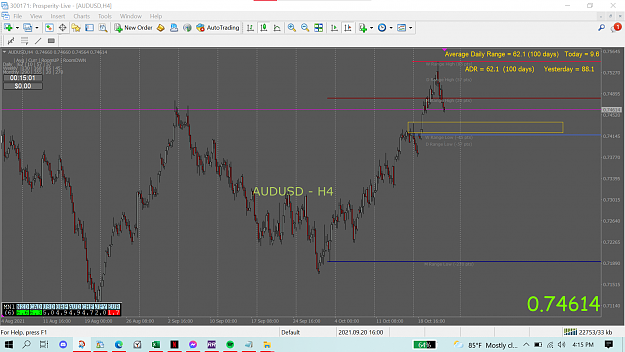
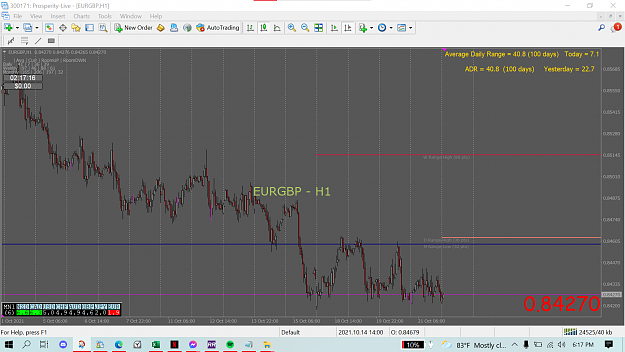
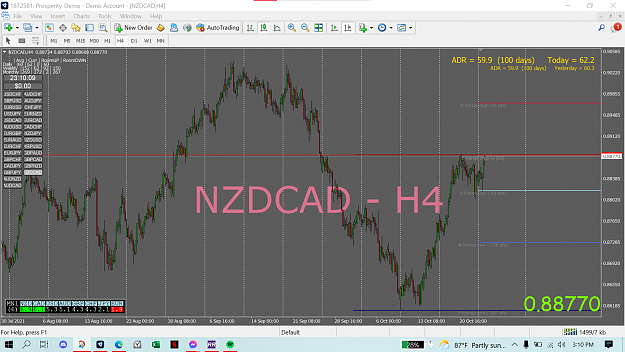
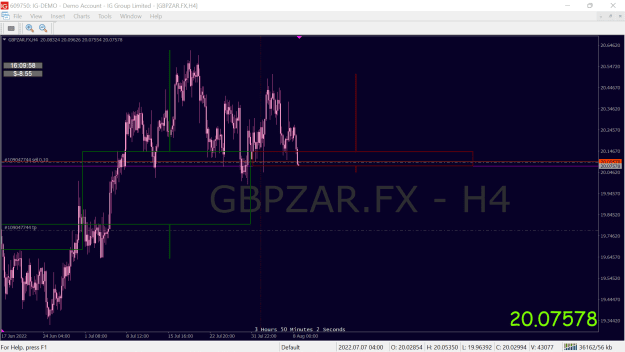
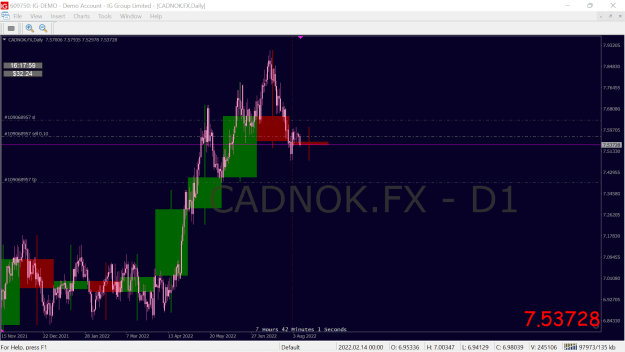
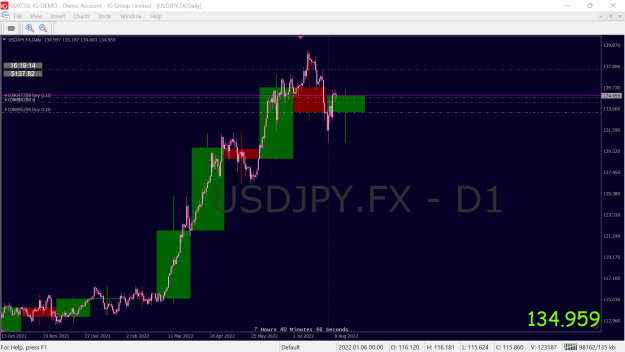
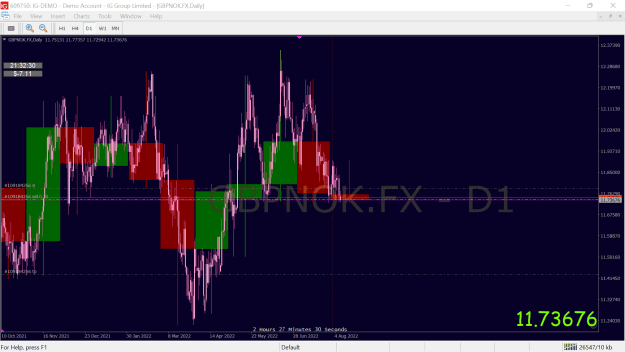
so back to it. all price action. i use the m-candle indicator to visualize a true monthly candle across all timeframes, and i look at the h1 and up timeframes to see how these candles are being created. i also use m-candles as a type or moving average, but with much more valuable info
i only enter on h1 and h4, and i use the structure inside of the monthly candle to determine trend and its direction, momentum, and probability.
you can join my discord https://discord.gg/Ge5sWUdN ill be glad to see you there.
lets eat.
i only enter on h1 and h4, and i use the structure inside of the monthly candle to determine trend and its direction, momentum, and probability.
you can join my discord https://discord.gg/Ge5sWUdN ill be glad to see you there.
lets eat.
be a thinker before being a reacter