Don't think you will get any replys. Note: This group is closed for now and has become private
Ignored
the answer lies in the TF, he is using lower TF, so these indi wont work. and you have to wait for close to decide on entry. You wait for price come to you not chase it.
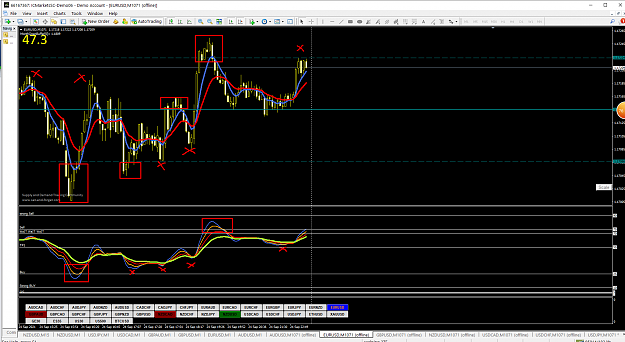
as i said there is some tricks for higher probability trades in the rsi indicator we should see some blanc space between the MAs and the RSI line that goes from the 50 area to the support or resistance area i have attached some pairs to show when we have the blanc space and when we don't in this wat we trade only the higher probability ones {image} {image} {image} {image}
Ignored
you keep saying blank space between the Mas and the RSI .... so confused ....there is no RSI line (RSI=none color remember?) so you can see there is only blank space between 21ema and the bundles of rest of Mas cloud
what is the psychologish aspect behind the blank space? how would you interpret why it surfaces?
Hm this looks interesting, but I think in this strategy we don't need the rsi, we are only interested in its window in order to get info from it 10, 30, 50, 70 &90 line
there is another big problem. most of times different timeframes shows different signals. for example M15 shows a sell signal while H4 shows a buy signal and H1 doesnt show any signal. look beneath images in M15 market reaches resistance level but in H1 and H4 market produces a buy signal. {image} {image} {image}
Ignored
there are waves in a wave, so are trends in a trend, consider H4 = 4xH1 =4x4xM15 there is no wonder you get buy signals in lower TF but sell signal in higher TF. You need to chose your TF and make your analysis consistent to that, to get comparable signal. anchor TF is H1 for dominant trend, res sup, OS, OB etc... then move to M15 or M5 to find best entry point
this is a payapa's entry, in H1; then you can move to M5 to see in M5 the confirmation TDI trend up, entry up;
Similarly, from 1.0808, minor buy area, could be a buy for EURCHF, SL 1.0785; TP1/2/3/4/ as given here upto 1.0907
edit EURCHF trade, dayly and H4 trend strong down, so if place buy trade, it should be clear is a counter-trend
Did anyone see what happened to g pairs...such as gbpusd or gbpjpy? afer ma hit support (green) line, next couple hours MA move away from support line...
Ignored
for GN for example papaya or not, check in H4 you see GN at time in general down trend channel, H1 not so clear but down too, GN price at near the top even, so it was futile to enter a Buy because chart shown it hit OS, support area up there
{quote} Hi Alhalawi, First thing, thank you for your awesome indicator. I would like to send you a big thank {image} In this picture, the red circle that I drew is the zone that EMA meet the support line at the first time, but the price keep going down then the Support line moves down too?
Ignored
did you wait to place Buy trade on the 18\5? It is srung off the papaya's minor buy area if it bounced from here then it is a valid signal, and at the bottom of the H1 price up channel too, so good trade.
{quote} the support did not hold at this zone and it broke so we are now on a new support but the thing is NZDUSD is trending down on higher timeframe so that's why we are trying to find a way to filter our trades to enter positions within the higher time frame trend i beleive some guys here are working on it so let's do this together
Ignored
this phenomen happened often and still un-expected, they are called level extension. If you read the original papaya pdf you could see the down trend ends at the minor buy zone. So he did prepare for this extension, if price gets over that minor level we got to deal with a break out, a sell instead of Buy