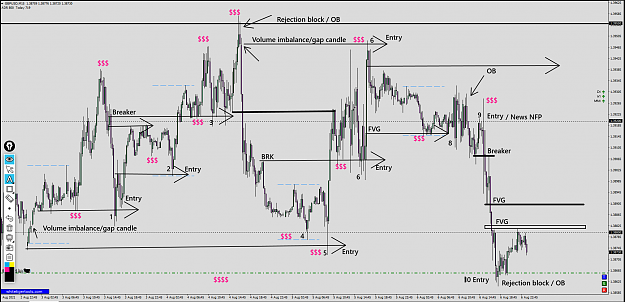
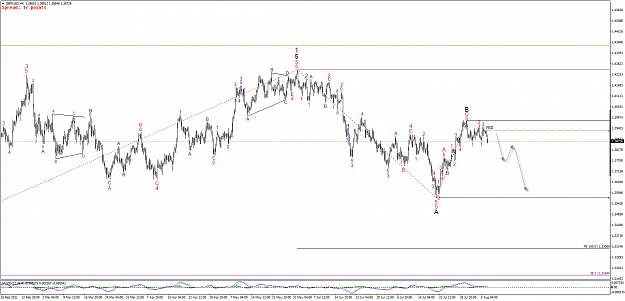
Disliked{quote} Took another look. That bottom looks kind of absorption, but very weak one: Bid imbalance at LOD, then price bounced a little (tp or passive buys that hold the price) {image} Probably 1.38 could be the next stop/consolidation, if 1.386 - 1.385 doesn't hold. Otherwise up to 1.393+. But it's better to react rather than predict{image}Ignored
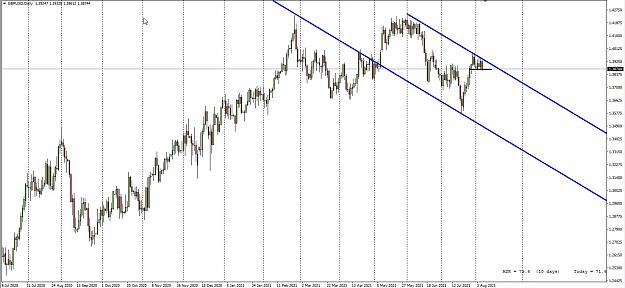
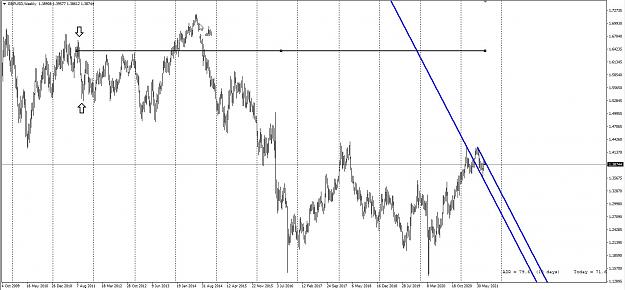
The selling seems reluctant, for the amount the Dollar rallied on Friday it didn't cause much of a sell off on GU comparatively, we're back in weekly supply on DXY which I think will continue to hold after pushing a little higher. So still seeing this as a correction before continuing bullish. I'd like to see 1.40 in the next week or two
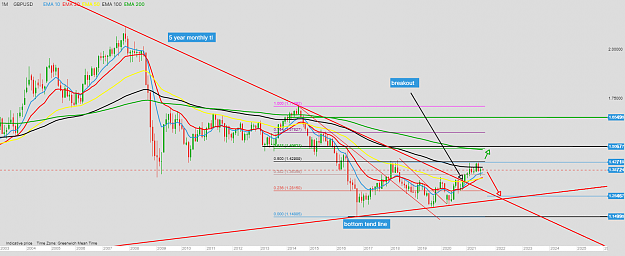
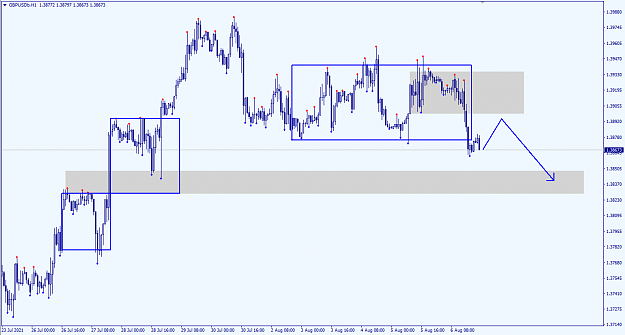
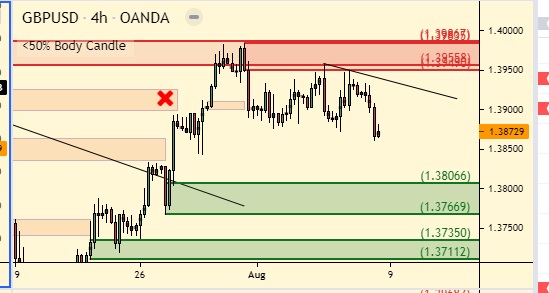
Also, I'm not really into head and shoulders patterns but you could say the H4 is forming the last shoulder of an inverted HnS which would project up to 1.42. One of those patterns that fails as often as it works, is sometimes indicative of a big move being cooked. Honestly with chart patterns I think you just see what you want to see. Also this looks very much like a bull flag on H4 which we're at the bottom at now.. so again like Wolfram says theres a chance that mid 1.38s holds too. From my limited experience a bull flag is a pretty reliable pattern on GU. If it holds bulls will be very happy if we can push up to the high 1.39s next week for a breakout
Attached Image (click to enlarge)
Attached Image
11