EURUSD Weekly Technical Outlook
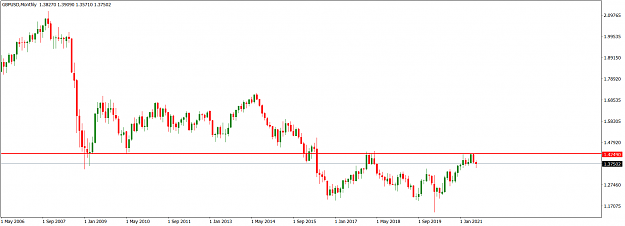
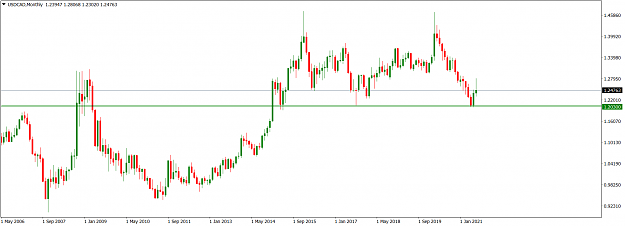
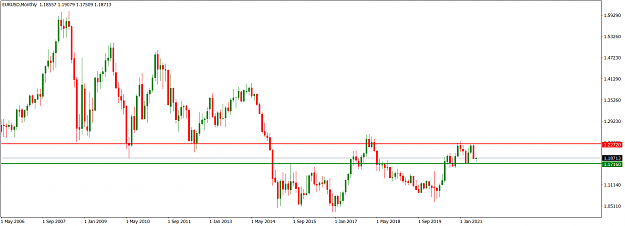
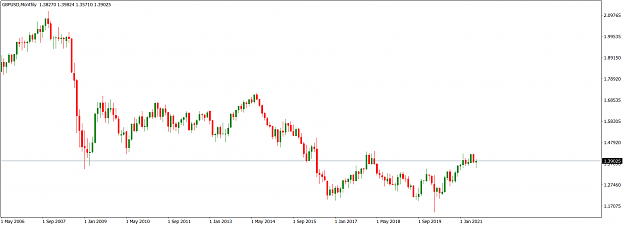
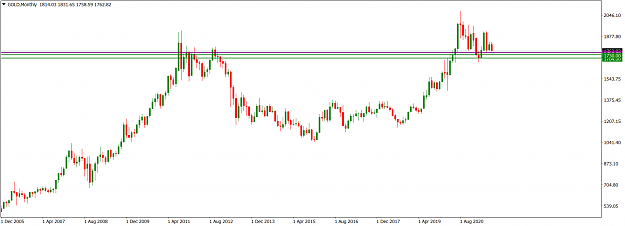
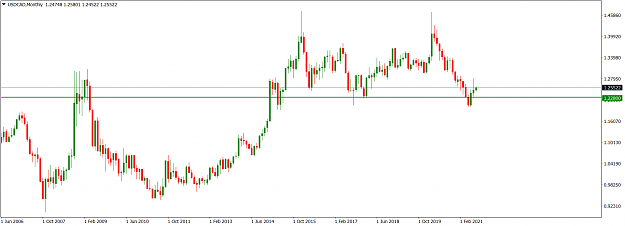
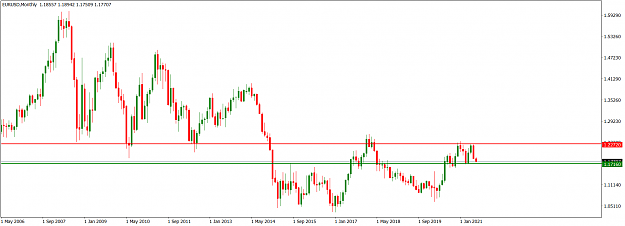
The EURUSD market is bearish. On the monthly time frame, a bullish candlestick took market operation to the 1.22720 horizontal resistance area (red) but could not break above it. From the area, a bearish candlestick was printed in June that broke below the low of the bullish candlestick printed in May, showing a bearish rejection of the area. Meanwhile, the interim market operation in July is bearish and below the low of the June bearish candlestick. Market operation is presently tackling the 1.17160 horizontal support area (green).
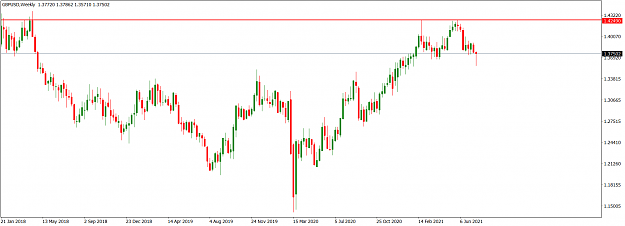
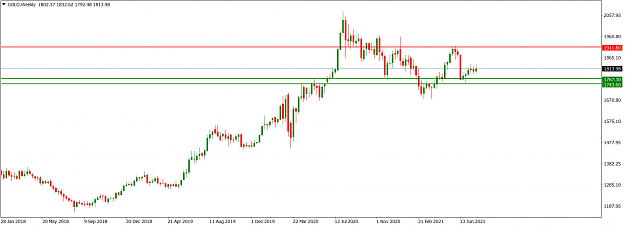
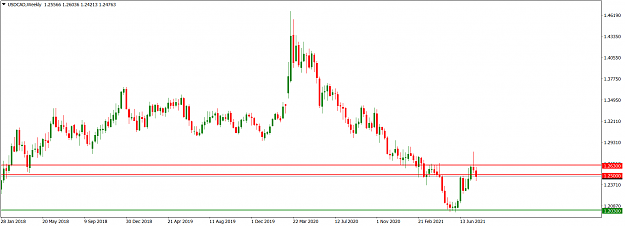
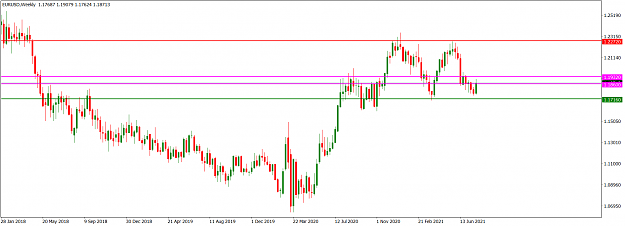
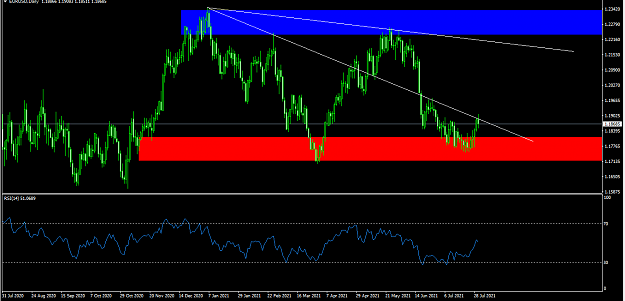
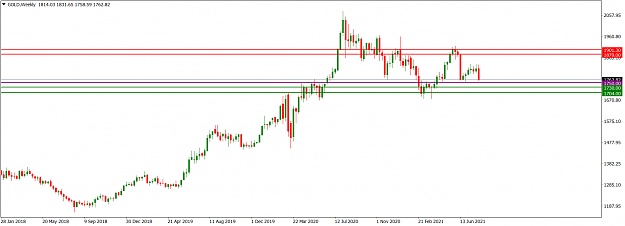
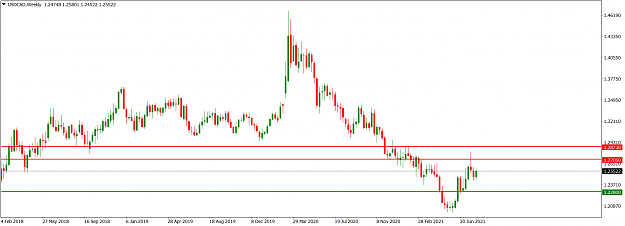
Market operation on the weekly time frame is bearish but it is approaching a horizontal support at the 1.17160 area (green) seen on the monthly time frame. We may see further bearish move in the early part of this week, but it will take a significant breakdown of the 1.16100 handle (blue) before we can have confidence in a sustained bearish drive.
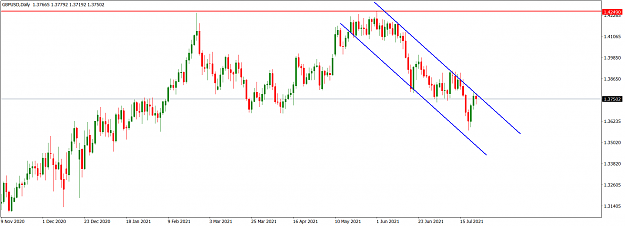
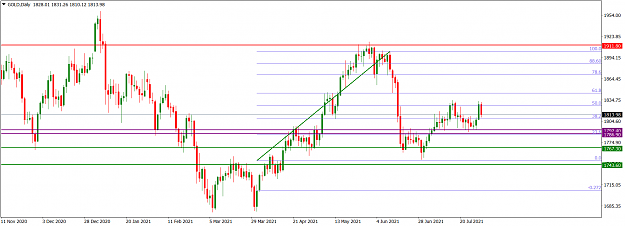
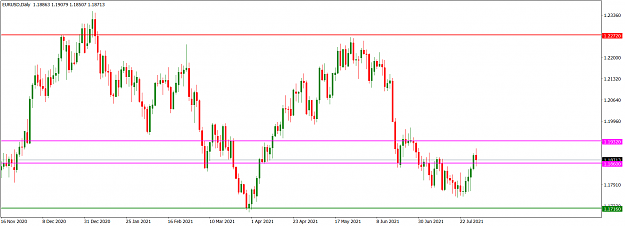
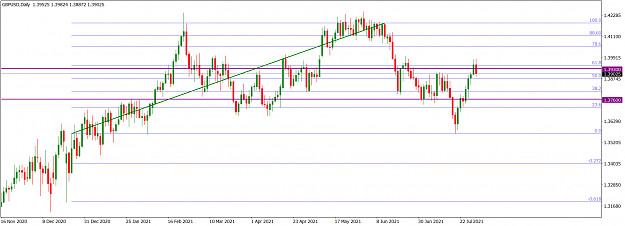
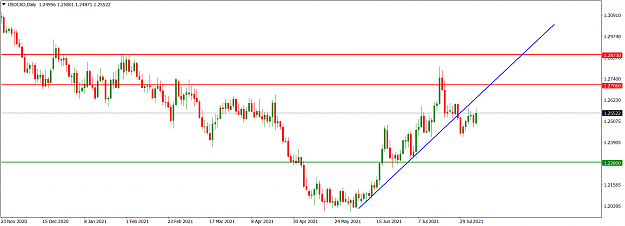
Price action on the daily time frame is technically bearish but there is a decrease in bearish momentum as it approaches the 1.17160 horizontal support area (green). We may see some sideways or pullback of price action in the area in the early part of this week, but bears will likely restore their influence in the market after such reaction.
I may be wrong. Trade safe and prosper.
KP
The EURUSD market is bearish. On the monthly time frame, a bullish candlestick took market operation to the 1.22720 horizontal resistance area (red) but could not break above it. From the area, a bearish candlestick was printed in June that broke below the low of the bullish candlestick printed in May, showing a bearish rejection of the area. Meanwhile, the interim market operation in July is bearish and below the low of the June bearish candlestick. Market operation is presently tackling the 1.17160 horizontal support area (green).
Attached Image (click to enlarge)
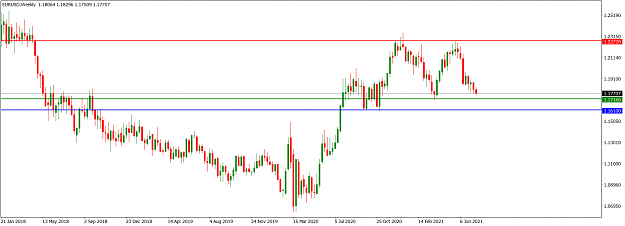
Market operation on the weekly time frame is bearish but it is approaching a horizontal support at the 1.17160 area (green) seen on the monthly time frame. We may see further bearish move in the early part of this week, but it will take a significant breakdown of the 1.16100 handle (blue) before we can have confidence in a sustained bearish drive.
Attached Image (click to enlarge)
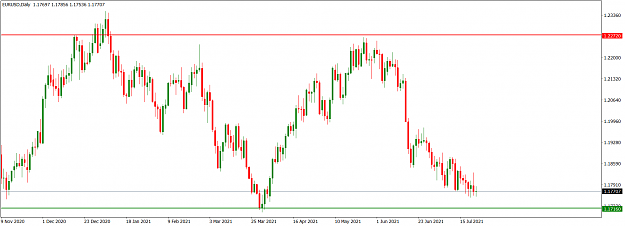
Price action on the daily time frame is technically bearish but there is a decrease in bearish momentum as it approaches the 1.17160 horizontal support area (green). We may see some sideways or pullback of price action in the area in the early part of this week, but bears will likely restore their influence in the market after such reaction.
Attached Image (click to enlarge)
I may be wrong. Trade safe and prosper.
KP
Do your homework, follow the footprints of smart money
1