I was thinking 131.85 was going to be the low of the day, but price is still pushing.. Good bet we will see 131.55 today, I'll dump 20% there and see what next week brings.
Forex has been soo grindy lately that we haven't see any traps like this in a long time. It takes some experience to realize you're in a trap, you will see wide spread bars pushing really fast in one direction. When you're on the right side of a trap, its like being handed a blank check.
Bounced at 131.56, hopefully I wasn't the only one selling this like theres no tomorrow.
I struggled for a long time with TPs, and still do especially in choppy markets. But I like to go up a time frame and see where stop losses would be for the other side.
Closed down the batch of orders taken below 132.30. Price is just above a HVC from April 6th on H4 chart. Going to keep a few orders taken from 132.70 open, but 70% of the position has been closed.
I'm going to take a break though, going to take a summer vacation and need to look into some Futures brokers. Supposedly Futures offers 100:1 leverage while Forex is capped at 50:1. Also with how fast the ADR is dropping in Forex, not counting last Thursday and Friday, but Gold and Oil Futures look like they both have ADRs above 150. Gold on Thursday was a 600 point drop.
Just wanted to share a trade that i took today. A very simple principal that i follow for my trades now. Seeing what you want to see, where you want to see. The main idea of this trade was framed around the posts made by "hiddengap(so credit goes to him". with a few minor tweaks to suit my own style.
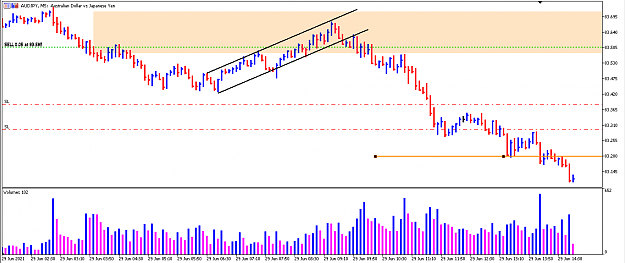
The shaded zone would be a WRB from the 1H. when prices enter this zone, i look for a short. as simple as that. and we use VSA to enter.
Take a look at the shaded zone. just before the channel broke, i see hyperbolic volume, EvR bar, a failed test and a good supply bar all appearing back to back before we break the channel. Once we break the channel, we get a nice 2 bar reversal. And all this happens at a zone, where we expect to see supply.
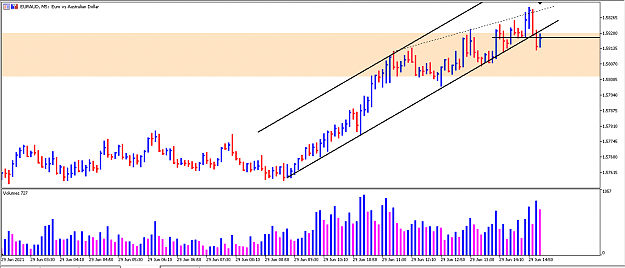
(apologies for not clearly marking out the chart. will try to do a clearer one when i've got the time. A potential trade seems to be setting up in EURAUD so back to my charts.)
Hi guys, a quick question. Anyone trading using wrb zones? how would you trade a day like this?
Attached Image (click to enlarge)
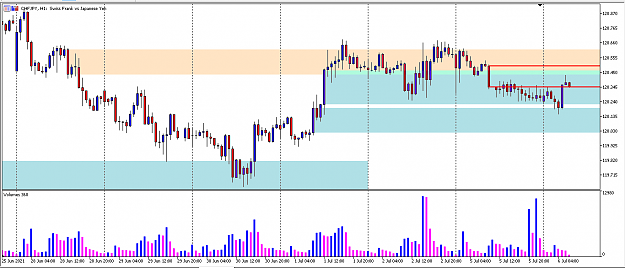
This is CHFJPY. As we speak we are actually clustered in between 4 wrb zones. The zones shaded in blue are demand wrb bars. the ones in red are supply wrb bars. and the one that is encapsulated between the red line is also a supply wrb.
The easier answer that i am opting for is to totally stay out of this pair until things clear up.
But lets just say for educational purposes, if you had to put a trade on, would you be bears or bulls based on the wrb bars?
Hi guys, a quick question. Anyone trading using wrb zones? how would you trade a day like this? {image} This is CHFJPY. As we speak we are actually clustered in between 4 wrb zones. The zones shaded in blue are demand wrb bars. the ones in red are supply wrb bars. and the one that is encapsulated between the red line is also a supply wrb. The easier answer that i am opting for is to totally stay out of this pair until things clear up. But lets just say for educational purposes, if you had to put a trade on, would you be bears or bulls based on the...
Ignored
I wouldn't touch a WRB bar, go down to M30 or M1 (where you need to be) and study volume there.
Small volume with big bars is the direction to trade.
Here was a chart I posted yesterday so I apologise to anyone who has seen this one.
It was EURUSD using Futures volume data but it tells us the truth - what really happened.
I was looking for increasing volume to go long or below average volume to go short.
Volume just wasn't there so I took about 15 short scalps over a few hours (all separate trades) to take advantage of the big players intention TO DO NOTHING
That is a signal by itself
Cheers
Attached Image (click to enlarge)
Trading thin liquidity at the boundary of the charts
Hi guys, a quick question. Anyone trading using wrb zones? how would you trade a day like this? {image} This is CHFJPY. As we speak we are actually clustered in between 4 wrb zones. The zones shaded in blue are demand wrb bars. the ones in red are supply wrb bars. and the one that is encapsulated between the red line is also a supply wrb. The easier answer that i am opting for is to totally stay out of this pair until things clear up. But lets just say for educational purposes, if you had to put a trade on, would you be bears or bulls based on the...
Ignored
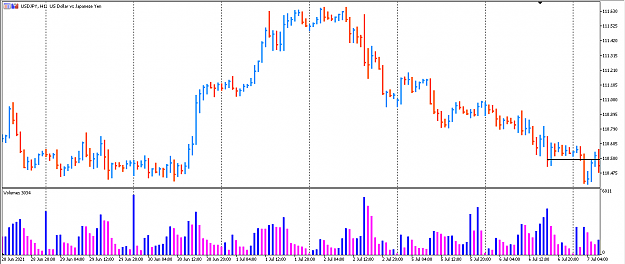
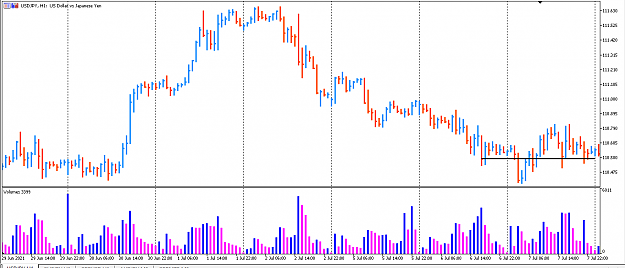
Your volume seems a little off. July 5th the highest volume during Asia should be on the 3 am bar. Also on June 28th the highest volume should be on the 3 am bar as well.
If you look at the low of the July 5th 3am bar, price tagged it and dropped, good bet it was the highest volume.
Personally I wouldn't trust your volume. Here's a SS, sorry im not at home and just have my phone.
{quote} I wouldn't touch a WRB bar, go down to M30 or M1 (where you need to be) and study volume there. Small volume with big bars is the direction to trade. Here was a chart I posted yesterday so I apologise to anyone who has seen this one. It was EURUSD using Futures volume data but it tells us the truth - what really happened. I was looking for increasing volume to go long or below average volume to go short. Volume just wasn't there so I took about 15 short scalps over a few hours (all separate trades) to take advantage of the big players intention...
Ignored
Nice. thanks for the reply. i understand the narrow range high volume bars is where you start studying the bars from i guess? Could you explain more about what you meant by increasing volume to go long or below average volume to go short? Did u arrive at this conclusion because the background or the context was bearish?
Also, i would love to know how u managed 15 short scalps? I tried scalping way back with the 5mins chart but kept getting whipsawed.
{quote} Your volume seems a little off. July 5th the highest volume during Asia should be on the 3 am bar. Also on June 28th the highest volume should be on the 3 am bar as well. If you look at the low of the July 5th 3am bar, price tagged it and dropped, good bet it was the highest volume. Personally I wouldn't trust your volume. Here's a SS, sorry im not at home and just have my phone. {image}
Ignored
oh my.. your rite.. The SS i posted was volume feed from a prop firm program called "the 5ers". Apparently, their volume feed is from a couple of brokers that has been combined.
I used ICmarkets and it seems like the volume feed there matches the SS u posted. looks like i've got to use 2 different MT5 platforms to trade now. one just to see the accurate volume.
{quote} Nice. thanks for the reply. i understand the narrow range high volume bars is where you start studying the bars from i guess? Could you explain more about what you meant by increasing volume to go long or below average volume to go short? Did u arrive at this conclusion because the background or the context was bearish? Also, i would love to know how u managed 15 short scalps? I tried scalping way back with the 5mins chart but kept getting whipsawed.
Ignored
Hi Shadowy
I was just referencing that EURUSD move. As it was in a bearish trend at that point, the data was strongly in favour of Bids. That means Buyers were placing higher levels of orders that were being executed by aggressive Sellers. So more Buyers but bearish move.
We would need to see a high level of Buying market orders at least double the amount of current Sellers liquidity to change direction.
Therefore we need a very high volume bar containing more than 75% of Buying market orders to break the downwards trend.
It never happened so low volume favours the current direction.
Volume attacks liquidity, that is the real battle.
Cheers
Trading thin liquidity at the boundary of the charts
Think I found a futures broker I like, just waiting for them to verify my info and get it funded.
Here is a demo trade, Gold Futures seems really straight forward using VSA. I took off half the position because you can see how on bar A as price came down to the low of the HV bar and found a little volume. Volume could be sellers trying to absorb buyers or it could be buyers stepping in. No idea, so I took half and will exit the other half if price starts approaching the high of the bar A. Like to see if I can take the other half down to the last swing low at 1794.
But I like the volatility though, that was a quick 24 points on the half position.
Closed it down, the current bar still has 3 minutes left on it but at the moment sellers don't seem to want to break that low. Waiting until LO then what this looks like.
VSA has a ton of advantages.
But my favorite is that you only need volume and maybe a horizontal line. Which means that its no big deal to switch trading platforms and don't have to worry about any custom indicators being left behind.
Well, I kinda miss my esignal wicks but they were only for aesthetics.
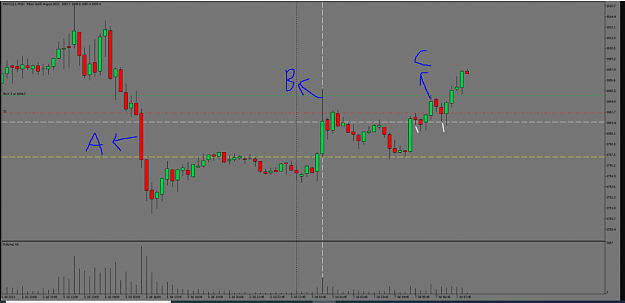
Here's 30 points, probably call it a day with 54 points in the bag, just too bad its fake money. Just looking back it seems like 3 out of 5 days are just as straight forward as today, feels like it could be a lot easier to trade than Forex. {image}
Ignored
Nice trade. I've reproduced your chart with a few markings. Hoping to get your take on it.
Attached Image (click to enlarge)
Bar A was the highest volume on the chart on this bar. Even when Bar B came, where you have drawn your horizontal line from, the volume on bar B was still very low compared to A. At what point did you decide to use bar B as a high volume reference bar? I'm guessing probably because it was the highest volume bar at that point of time for the new day?
When bar C came, it was probably the highest volume in the past 15 bars or so. So now this becomes our reference bar? but the very next bar after bar C was a down closing bar indicating weakness on bar C. and we had lots of weakness on the background with bar A and B. why long above bar C then?
{quote} Bar A was the highest volume on the chart on this bar. Even when Bar B came, where you have drawn your horizontal line from, the volume on bar B was still very low compared to A. At what point did you decide to use bar B as a high volume reference bar? I'm guessing probably because it was the highest volume bar at that point of time for the new day?
Ignored
You guessed it, that spread and volume during Asia is climatic. We know that price will return and react to where professionals take their positions, the ND and ND UT into the close of Bar B are big clues that B was an important bar.
Bar A is the highest volume of the previous day, when I see those wide spread big body close just off the lows type of bars, I see them as absorption bars and basically look for price to drop below the bar, come back and tag the low/close then continue to drop. If price rallies up into the body of those bars then I'm no longer interested and wait for something else to happen.
{quote} When bar C came, it was probably the highest volume in the past 15 bars or so. So now this becomes our reference bar? but the very next bar after bar C was a down closing bar indicating weakness on bar C. and we had lots of weakness on the background with bar A and B. why long above bar C then? nice trade though.
Ignored
I don't see Bar C as climatic volume, I see it as average volume. Look at the volume behind bar B, volume on Bar B dwarfs all of the volume for the last 20 bars or so. Bar C volume is just slightly higher, the volume on bar C is really increasing volume on up bars which is bullish. Its not stopping volume its not climatic volume. But to look at it another way, if we were to use Bar C as a reference bar.. Where is the reaction to bar C? There is no rejection to the close or the low.
Couple of reasons for the long, first is this post. As we came down to the lows of Bar B, we saw a slight increase in volume, that increase in volume was just enough to keep price from pushing through the lows of Bar B, then we saw 3 bars on obvious decreasing volume and price refusing to push through the low of Bar B. That is a prime example of "if price isn't bearish, it must be bullish".
Second reason is that the close of Bar B was resistance turned support. The ND and ND UT was resistance, then we found support off the 2 tests during London.
{quote} You guessed it, that spread and volume during Asia is climatic. We know that price will return and react to where professionals take their positions, the ND and ND UT into the close of Bar B are big clues that B was an important bar. Bar A is the highest volume of the previous day, when I see those wide spread big body close just off the lows type of bars, I see them as absorption bars and basically look for price to drop below the bar, come back and tag the low/close then continue to drop. If price rallies up into the body of those bars...
Ignored
Nice explanation. I guess your using the high, low and close of high volume bars or what gavin would term as "yao ming" bars as S/R points? I read through your post on how you actually trade and was wondering a couple of things.
Quoting what you had said on a previous post, "I start out by looking for high volume bars and patiently wait to see how the market reacts to their close. Sometimes I will see, for example, a weak bar and price doesn't react to the close, but instead reacts to the low of the bar. I take note of it, but I don't place trades unless I see rejections off the high volume bar's close."
The part that i'm working on most is where you have mentioned rejections off the high volume bars close. I understand VSA itself is subjective but what would be an objective way of determining rejections off the high volume bars close. The way that i have been doing this is by using a lower timeframe to spot turning points using several of wyckoff concepts, examples would be, Shortening of thrust, Cluster of closes, swell in volume, etc etc.
But what happened at the end of the day was analysis paralysis. I got 5 things telling me to take a trade and 5 things telling me not to take a trade. I abandoned the idea of a Multiple timeframe and switched to using a single timeframe. But by the time the principles came into play, prices would have already started to take off. lol.
My point is how would u try to put in a more objective definition of rejections off high volume bar's close? and just wondering why only the close? what about highs and lows and also the 50% or mid-point of a high volume bar?
{quote} You guessed it, that spread and volume during Asia is climatic. We know that price will return and react to where professionals take their positions, the ND and ND UT into the close of Bar B are big clues that B was an important bar. Bar A is the highest volume of the previous day, when I see those wide spread big body close just off the lows type of bars, I see them as absorption bars and basically look for price to drop below the bar, come back and tag the low/close then continue to drop. If price rallies up into the body of those bars...
Ignored
For educational purposes, Would you have taken this trade? this was from USDJPY yesterday.
Attached Image (click to enlarge)
i see a beautiful supply bar where i have marked with a black horizontal line. i wouldn't say this is buying volume since the next few bars all held within the range of this bar and there was no signs of buying.
at the 5th last bar on this chart, we broke down again on healthy bearish volume and a strong close. we retrace up and 2nd last bar is a ND and last bar is a 2 bar reversal.
I guess this is the part where i would label it as "Rejections off the high volume bars close". I would enter a short now.
Attached Image (click to enlarge)
and well, i take a loss. market immediately reversed back up. would you have shorted at the same bar that i did since we saw a rejection off the close?