I've been pretty impressed with the Aggressive version of the Daylight strategy this past week so I modified an existing indicator to generate an arrow the first time a candle closes above, or below, the 5 SMMA high/low channel and I want to share it with you all. It should work on any timeframe, any currency pair.{file}{image}
Ignored
Thank you for sharing the modified indicator. I also appreciate you sharing the source code as this should allow someone to add functionality for only getting signals when the sub-window MAs are properly aligned.
So, for any coders out there, please feel free to make the necessary adjustments. It'll be much appreciated.
Thank you Laura for your outstanding contribution and ideas. I have further developed the use of Wlliams% MA. Have backtested some pairs, with promising results. Also, demo traded with great success. Pay close attention to the picture i have made. Study all details especially how Williams % top and bottom for swing high and low. Manualy make a line top and bottom for the average of Williams%. This is your swing high and low. Trade only in the trend direction (Black Line) Yellow line is very important and is used in multiple ways. StochRSI is the...
Laura, I am curious to know how many different instruments you follow when using this system - do you follow just a few forex pairs or are you constantly switching between all the different time frames & pairs to find a setup? How is your screen setup? I realize everybody will have a different style or format, I'm just curious about what works for you.
I've been pretty impressed with the Aggressive version of the Daylight strategy this past week so I modified an existing indicator to generate an arrow the first time a candle closes above, or below, the 5 SMMA high/low channel and I want to share it with you all. It should work on any timeframe, any currency pair.{file}{image}
Ignored
Hello can you please create a custom indicator for the William% + MA shown in the picture above? one i can just drop on the chart and it loads the MA and William% automatically, instead of having to drag the mAs ontop of the william% window.
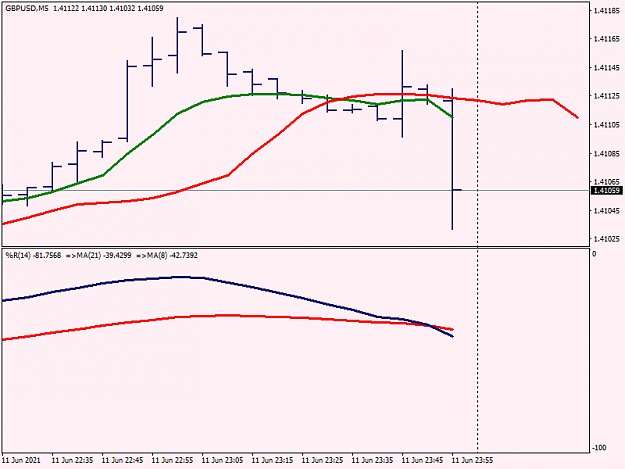
The chart is from the close on Friday- Laura, I am curious to know how many different instruments you follow when using this system - do you follow just a few forex pairs or are you constantly switching between all the different time frames & pairs to find a setup? How is your screen setup? I realize everybody will have a different style or format, I'm just curious about what works for you. {image}
Ignored
I'm old school - I prefer having my core charts open (around 8 or 9 instruments) and periodically flicking between them. It's how I learned to spot opportunities so it feels more comfortable to me than any other method.
However, we also now have the advantage of the dashboard/scanner that Barraka made for us. If I spot an opportunity on there, I tend to open the chart and decide whether it's worth trading.
{quote} Hello can you please create a custom indicator for the William% + MA shown in the picture above? one i can just drop on the chart and it loads the MA and William% automatically, instead of having to drag the mAs ontop of the william% window. Thanks
Ignored
I supplied a template on the first post. You shouldn't need to drag MAs if you apply the template (then you can manually add the custom indicator as well if you like).
{quote} Your chart reminds me of a point I haven't made yet. There will be times in aggressive mode, as in your highlighted area, where daylight occurs before we get price closing on the correct side of the channel. It's perfectly fine to take a chance on entering before the bar closes if it seems fairly obvious the bar is going to close on the correct side. In your example, we got the huge bar up on the hourly. Had we taken a chance and entered 15 minutes before the bar closed, we would have got in at 8 pips lower than waiting for the hourly bar...
Ignored
Great explanation,maybe a weird looking GBPUSD I submitted :-).
I can see the very first look at the chart after Friday had concluded is that the EMAs sub-window filter is excellent.I would not take any see positions there,not even aggressive,that are days that price action combined with that fake spike protected the trade so well,I like the channel very much using H1 and possibly M15,what a great system that helps you with unwanted draw-down....thank you again,keep safe and happy trading week to you and all daylight trading crew.
{quote} Great explanation,maybe a weird looking GBPUSD I submitted :-). I can see the very first look at the chart after Friday had concluded is that the EMAs sub-window filter is excellent.I would not take any see positions there,not even aggressive,that are days that price action combined with that fake spike protected the trade so well,I like the channel very much using H1 and possibly M15,what a great system that helps you with unwanted draw-down....thank you again,keep safe and happy trading week to you and all daylight...
Ignored
Because this is an old strategy of mine that I've brought back to life, I'm able to look at it with fresh eyes so I'm sure there will be further ideas and insights in future. I'm currently testing standard mode on 4H timeframe with some amazing back-test results.
Joined Apr 2020
|
Status: Daylight Roadmapper
|1,370 Posts
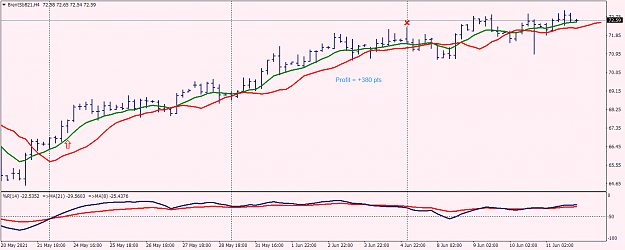
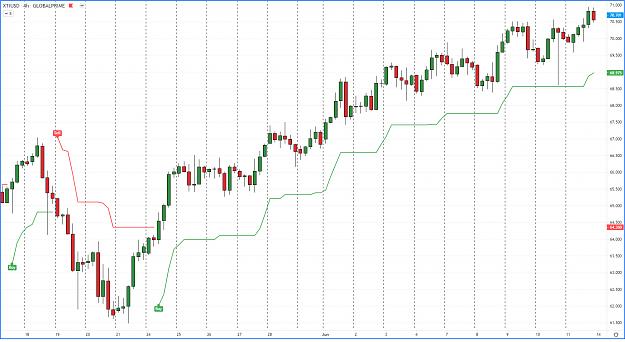
I previously mentioned using the -50 WPR line to form a bias. Here are a couple of examples from the 4H timeframe (a timeframe I'm finding remarkably lucrative in tests).
Oil first:
Attached Image (click to enlarge)
We get in when there is both daylight and the 21 SMMA is above the -50 line. We get out when there is negative daylight, for a total profit of 380 points.
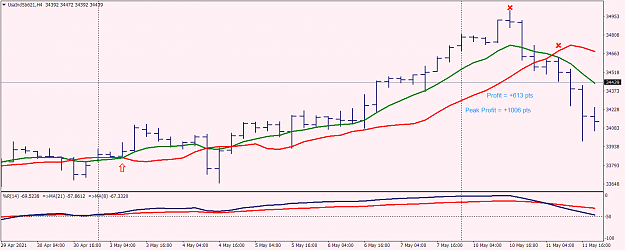
Dow next:
Attached Image (click to enlarge)
We get in when there is both daylight and the 21 SMMA is above the -50 line. If we get out when there is negative daylight, we bank a profit of 613 points. The peak profit was actually over 1000 points if you had exited by some other means.
{quote} Thank you for sharing the modified indicator. I also appreciate you sharing the source code as this should allow someone to add functionality for only getting signals when the sub-window MAs are properly aligned. So, for any coders out there, please feel free to make the necessary adjustments. It'll be much appreciated.
Ignored
& a push notification would be a great help if possible.
I previously mentioned using the -50 WPR line to form a bias. Here are a couple of examples from the 4H timeframe (a timeframe I'm finding remarkably lucrative in tests). Oil first: {image} We get in when there is both daylight and the 21 SMMA is above the -50 line. We get out when there is negative daylight, for a total profit of 380 points. Dow next: {image} We get in when there is both daylight and the 21 SMMA is above the -50 line. If we get out when there is negative daylight, we bank a profit of 613 points. The peak profit was actually over...
Ignored
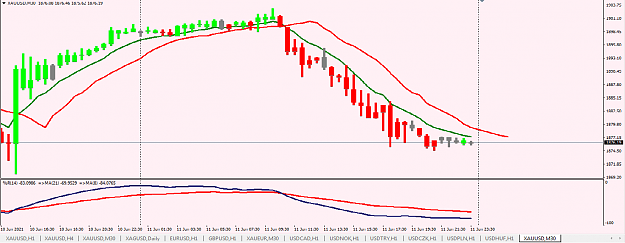
In your post above it seems you mean exit when there is negative DL on the Williams, or do you mean on the chart or either?
Gold H4 current chart below shows unsurprisingly that the losses come when the trend breaks down into consolidation where the 21 SMMA is still above the 50 line. A more Roadmap style of looking at price action in this example might work better than just relying on the indis? I'm guessing you wouldn't trade into nearby S&R even when using this system?
{quote} In your post above it seems you mean exit when there is negative DL on the Williams, or do you mean on the chart or either? Gold H4 current chart below shows unsurprisingly that the losses come when the trend breaks down into consolidation where the 21 SMMA is still above the 50 line. A more Roadmap style of looking at price action in this example might work better than just relying on the indis? I'm guessing you wouldn't trade into nearby S&R even when using this system? {image}
Ignored
Yes, negative daylight on WPR is correct.
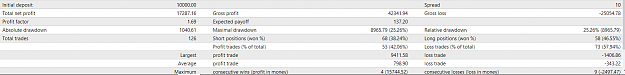
What i'm finding with most instruments is that the winners more than make up for the losers, even when you fail to take into account 'obvious' red flags like key resistance etc. But you are right, if we can steer away from consolidation phases (once we realise we are in one!), we can increase our odds.
Here's GU from 6th January 2020 to 1st June 2021, with size of 1 lot per entry on a 10k account:
Attached Image (click to enlarge)
This is based upon nothing very clever. It's simply having a core trading time for entries (1am to 4pm UK time) and exiting when an opposite signal appears.
{quote} Yes, negative daylight on WPR is correct. What i'm finding with most instruments is that the winners more than make up for the losers, even when you fail to take into account 'obvious' red flags like key resistance etc. But you are right, if we can steer away from consolidation phases (once we realise we are in one!), we can increase our odds. Here's GU from 6th January 2020 to 1st June 2021, with size of 1 lot per entry on a 10k account: {image} This is based upon nothing very clever. It's simply having a core trading time for entries (1am...
Hi..
Anybody here who is able to code an williams% ssma cross alarm, i would be very thankful.

Cheers Kirk

Ps. I will make a new Thread when i have made a complete strategy plan. A lot of details since it can be used in multiple ways. Thanks again Laura for leading the path.
Hi..
Anybody here who is able to code an williams% ssma cross alarm, i would be very thankful.
Cheers Kirk
Ps. I will make a new Thread when i have made a complete strategy plan. A lot of details since it can be used in multiple ways. Thanks again Laura for leading the path
I can't message you, keep us informed, indi.. many at publicistdotcom
I previously mentioned using the -50 WPR line to form a bias. Here are a couple of examples from the 4H timeframe (a timeframe I'm finding remarkably lucrative in tests). Oil first:
Ignored
Agree, the 4 hour is a great time frame, but can small accounts can handle the drawdown on swings?
Otherwise, use it as a guide for direction, day trade on the 15 Minutes chart
Attached Image (click to enlarge)
If you trade like me, you'll be homeless and broke within a week.