Disliked{quote} Swede Not sure its what you are looking for and if it does Square the Charts as you require But have you seen the thread in Platform Tech called Scale Fix Short CutIgnored
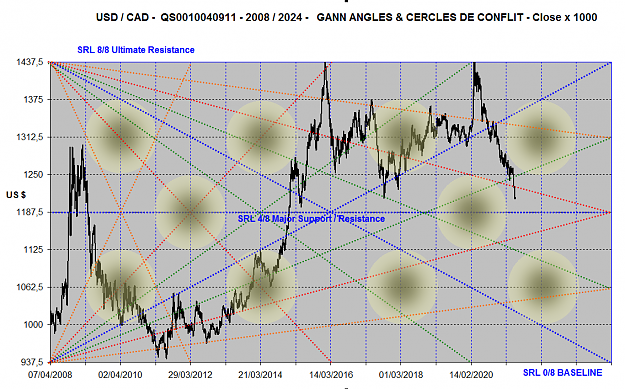
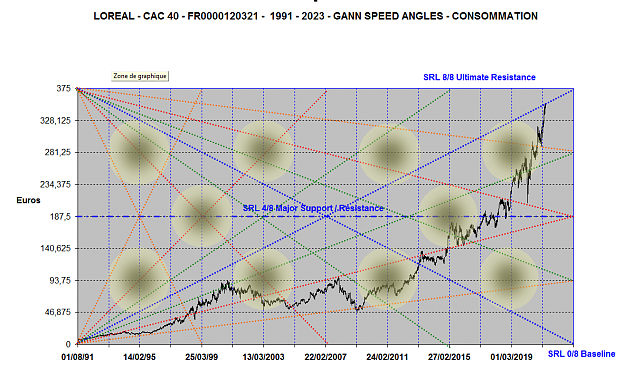
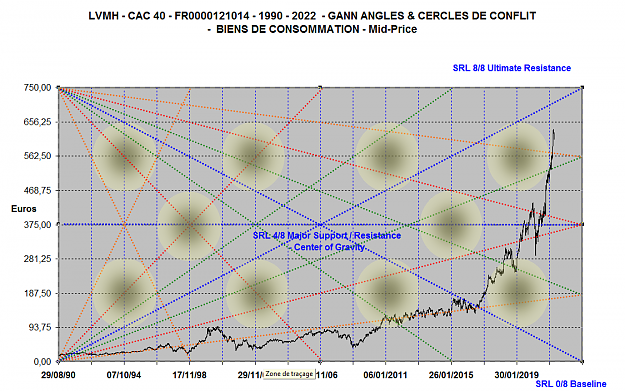
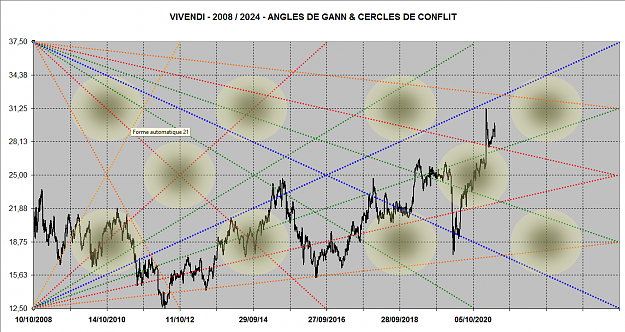
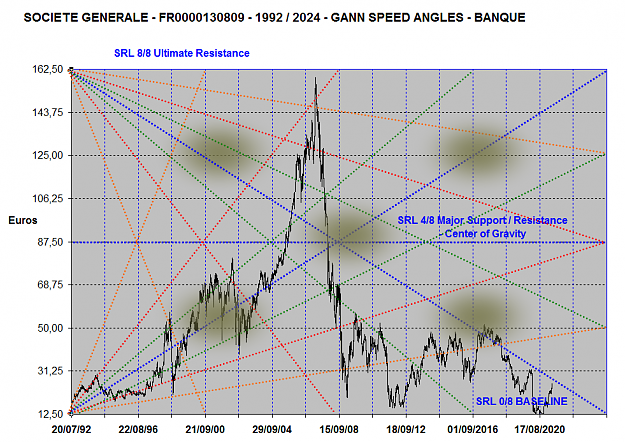
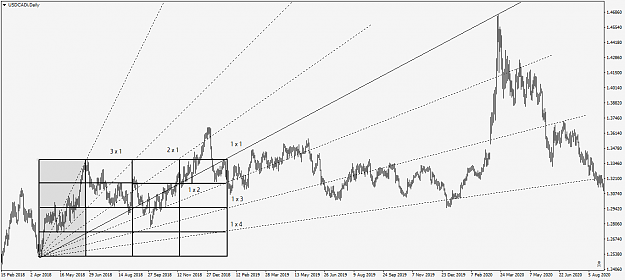
the grid was drawn back in 2018..from the low to high in the shaded area..and the 1 x 1 is always the most significant because by extension the angle is the square of the original range as drawn from the grid. Notice how the the high of march 2020 was predicted to the penny, where many shorts were instigated., and it is easy to see where additional shorts after the big move down....
But probably most important on this chart was the long entry (staying with the trend and the recommended way to trade the grid) in
Dec of 2019 when price retraced to the 1 x 4 where longs were instigated for a 1623 pip run....
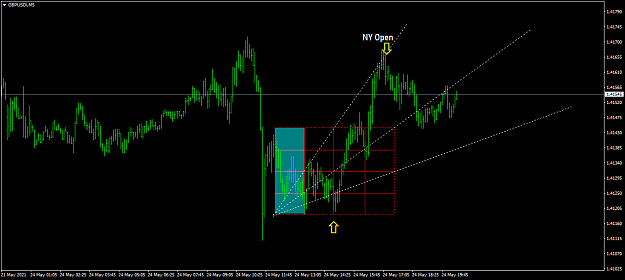
This works even on short term trends, but of course the profits are much smaller..
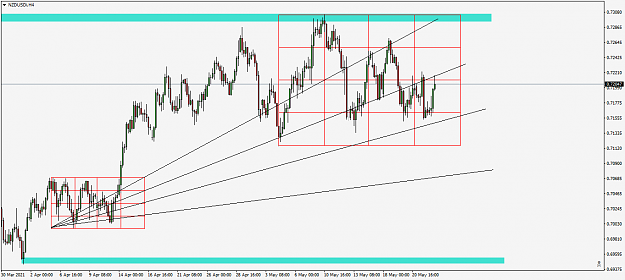
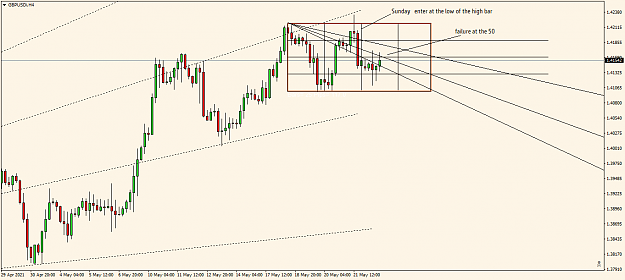
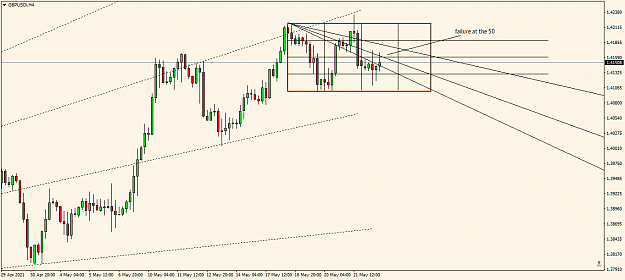
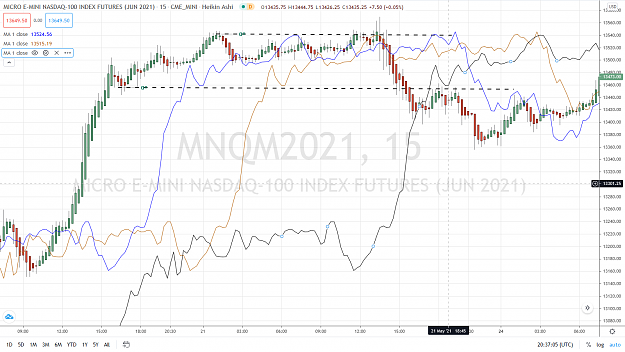
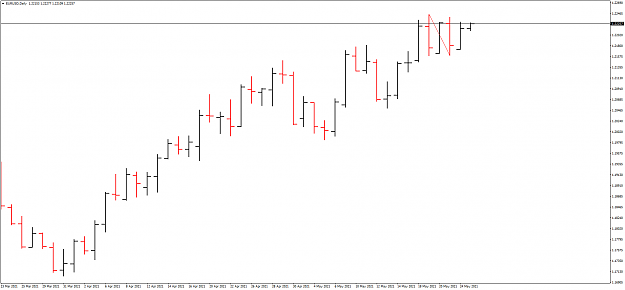
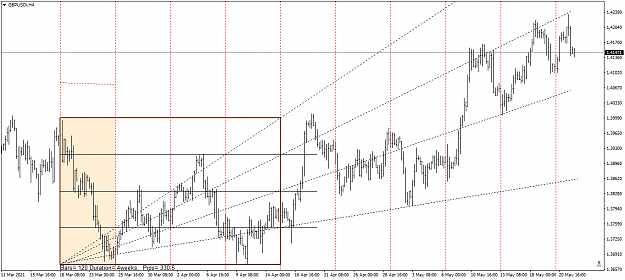
Also included is the updated 4 hour chart for Cable....pretty much to the penny on longs and shorts....notice also the cycles created from the impulse wave where we drew the grid....it is carried forward and caught many of the lows and highs for the past few week.
Attached Image(s) (click to enlarge)
2