Hey guys,
I'm a big fan of stochastic and of trend following but on the shorter timeframes
I'm trying to find what indications one really need for a successful trade while using the stochastic
I'm trying to find a simple yet effective strategy where stochastic and the superior trend timeframe are both used
If I go back to the basics and filter out the noise, I think I need the following conditions for a successful trade but maybe I'm missing things here and there and with your experience and knowledge, some of these missing parts could be solved easily. To me I feel like I need to:
- Follow a simple strategy to enter and exit a trade, that's essential to me without having too many indicators to watch
- Be on the right side of the superior trend timeframe (PA crossing the 5 EMA on the trend timeframe for example)
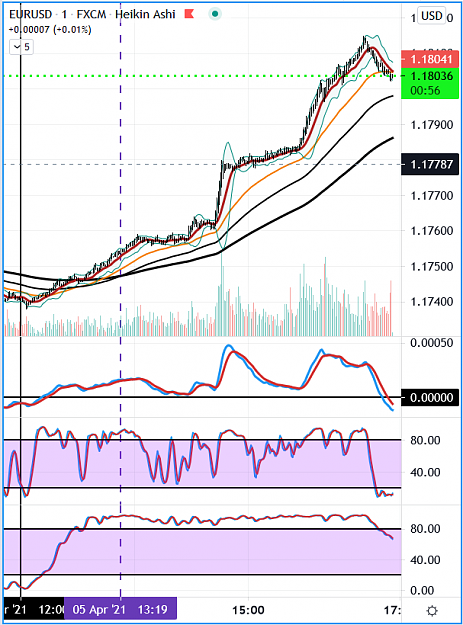
- For the stochastic to tell me when the price is in the overbought and oversold territories and ready to head up or down
- Know if the power is on the side of bears or bulls which I think could be seen through the volume histogram with the first red and green bar which can be observed just after the stochastic has crossed
- Take only buy orders in an uptrend or sell orders in a downtrend and most important of all finding a way to know when the bigger trend is reversing or not which has been my biggest issue so far
- Filter all the small trades that aren't worth it (But how?)
It's just food for thought but based on that and on my type of trading, would it not be possible to:
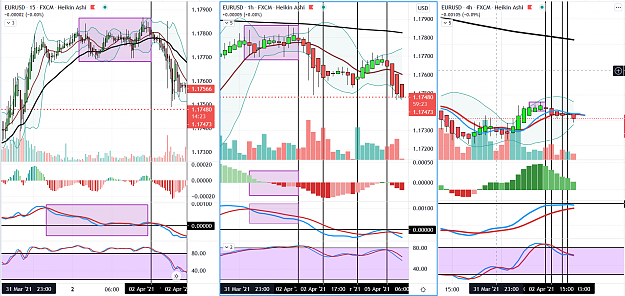
1/ Look at the bigger trend on say the 1H timeframe
2/ Wait for stochastic to be in the oversold or overbought areas on the 15 min chart, depending on the direction of the trend
3/ If the trend is upward, wait for stochastic to cross up. If it's downward, wait for stochastic to cross down
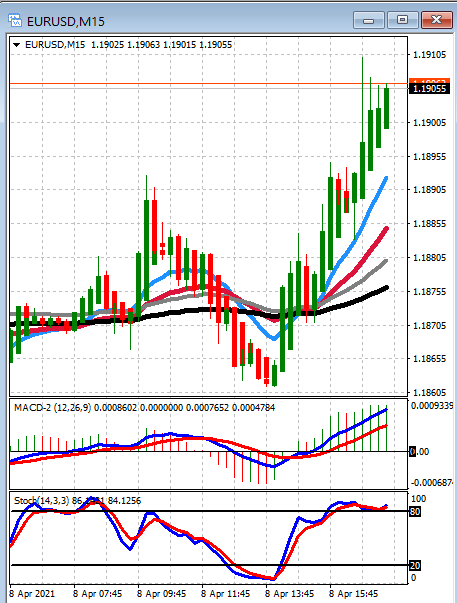
4/ Look at the very first bar of either the volume histogram or the MACD histogram to confirm stochastic crossing. If it turns green for an uptrend, enter a buy order. The opposite for a sell.
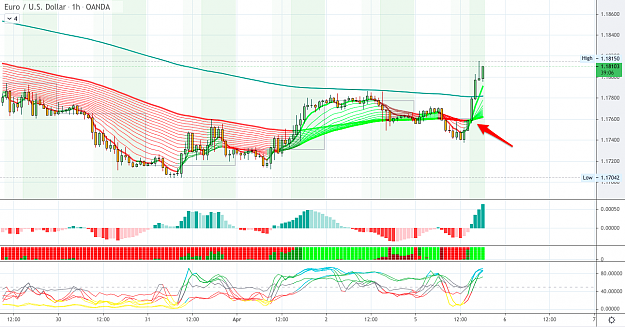
As for the trend, have you guys ever tried the Aroon indicator?
I haven't used it for long but it seems to be quite effective on the 1H timeframe to stay in the trend, though could add a level of complexity.
However, if too difficult to read it which I think only need some to get adjusted, the size and color of the first volume bar seem to be right on point when the trend is turning which could be used as a confirmation of stochastic crossing
To sump up, the indicators that could be used would be:
- 5 EMA, Aroon, Volume bars to determine the 1H timeframe
- Stochastic, volume, 5 EMA on the 15min chart
Just food for thought. What do you think? Does that sound good? What could be changed or improved? Are you using stochastic? Do you see any problems that could soon rise following this?
I'm a big fan of stochastic and of trend following but on the shorter timeframes
I'm trying to find what indications one really need for a successful trade while using the stochastic
I'm trying to find a simple yet effective strategy where stochastic and the superior trend timeframe are both used
If I go back to the basics and filter out the noise, I think I need the following conditions for a successful trade but maybe I'm missing things here and there and with your experience and knowledge, some of these missing parts could be solved easily. To me I feel like I need to:
- Follow a simple strategy to enter and exit a trade, that's essential to me without having too many indicators to watch
- Be on the right side of the superior trend timeframe (PA crossing the 5 EMA on the trend timeframe for example)
- For the stochastic to tell me when the price is in the overbought and oversold territories and ready to head up or down
- Know if the power is on the side of bears or bulls which I think could be seen through the volume histogram with the first red and green bar which can be observed just after the stochastic has crossed
- Take only buy orders in an uptrend or sell orders in a downtrend and most important of all finding a way to know when the bigger trend is reversing or not which has been my biggest issue so far
- Filter all the small trades that aren't worth it (But how?)
It's just food for thought but based on that and on my type of trading, would it not be possible to:
1/ Look at the bigger trend on say the 1H timeframe
2/ Wait for stochastic to be in the oversold or overbought areas on the 15 min chart, depending on the direction of the trend
3/ If the trend is upward, wait for stochastic to cross up. If it's downward, wait for stochastic to cross down
4/ Look at the very first bar of either the volume histogram or the MACD histogram to confirm stochastic crossing. If it turns green for an uptrend, enter a buy order. The opposite for a sell.
As for the trend, have you guys ever tried the Aroon indicator?
I haven't used it for long but it seems to be quite effective on the 1H timeframe to stay in the trend, though could add a level of complexity.
However, if too difficult to read it which I think only need some to get adjusted, the size and color of the first volume bar seem to be right on point when the trend is turning which could be used as a confirmation of stochastic crossing
To sump up, the indicators that could be used would be:
- 5 EMA, Aroon, Volume bars to determine the 1H timeframe
- Stochastic, volume, 5 EMA on the 15min chart
Just food for thought. What do you think? Does that sound good? What could be changed or improved? Are you using stochastic? Do you see any problems that could soon rise following this?