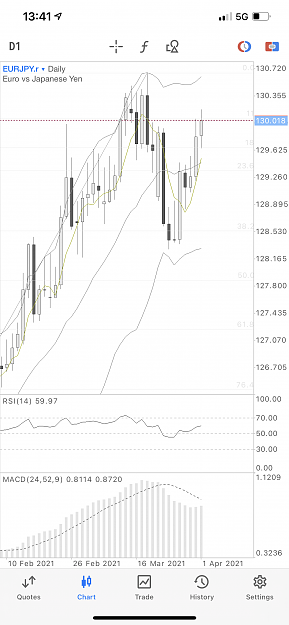
{image} Some good setups this week... bit early on USDJPY.
Ignored
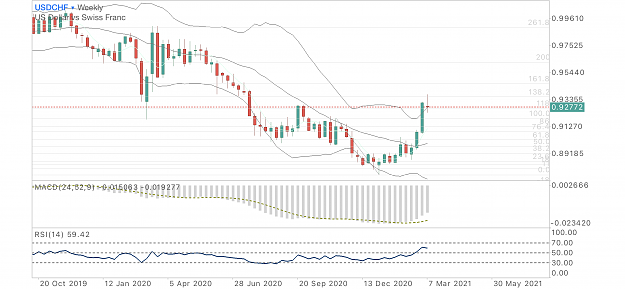
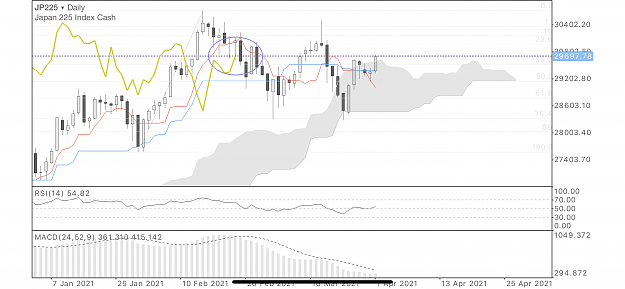
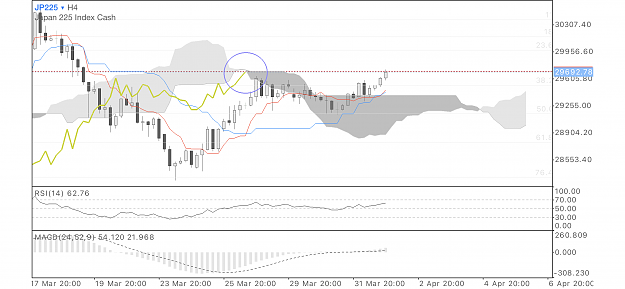
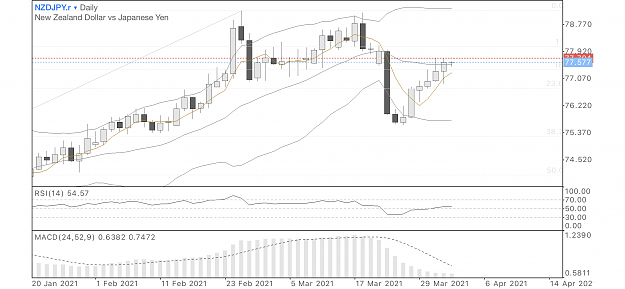
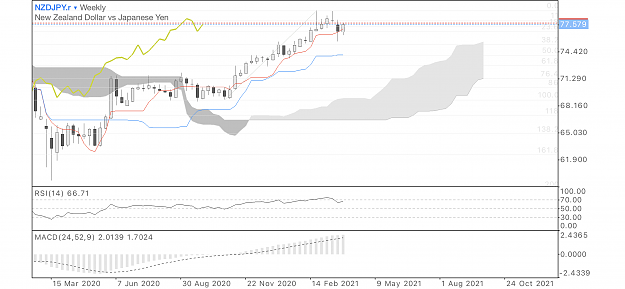
After the signal was confirmed on the daily, the weekly looks a bit like EURCHF and it will be interesting if the pin bar breaking Bollinger upper band is confirmed after the weekly close.
Attached Image (click to enlarge)
I used to be indecisive but now I'm not so sure...
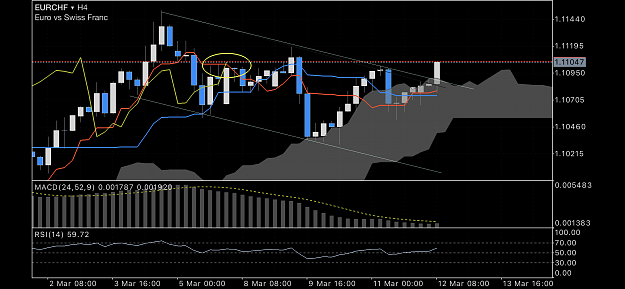
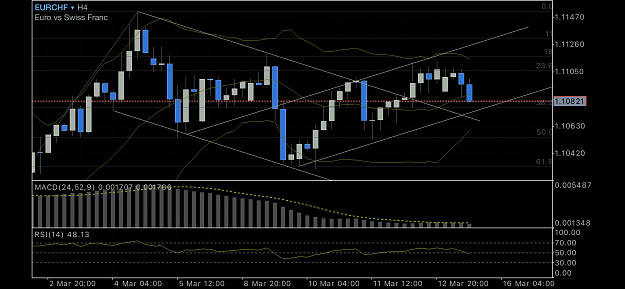
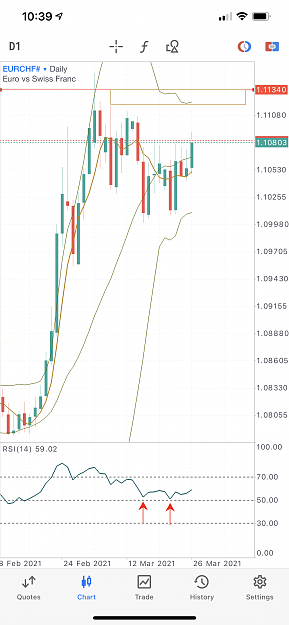
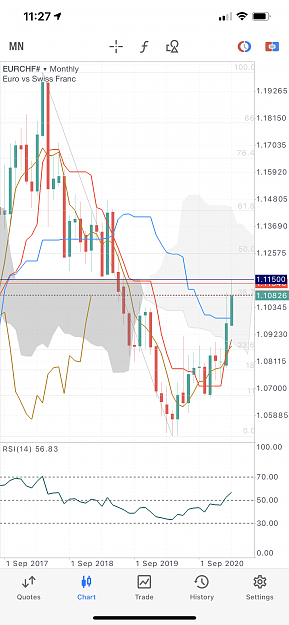
EURCHF sent a signal. The pair is retracing after reaching an important support/resistance visible on the weekly chart. On the daily the pair is back from overbought territory with a bearish divergence on RSI. {image} {image}
Ignored
It may turn sour...
Attached Image (click to enlarge)
I used to be indecisive but now I'm not so sure...
{quote} After the signal was confirmed on the daily, the weekly looks a bit like EURCHF and it will be interesting if the pin bar breaking Bollinger upper band is confirmed after the weekly close. {image}
Ignored
We should always feel free to explore other indicators in search for a better perception of markets.
If I use this system mainly to screen potential signals I like to check what Ichimoku Kinko Hyo has to say.
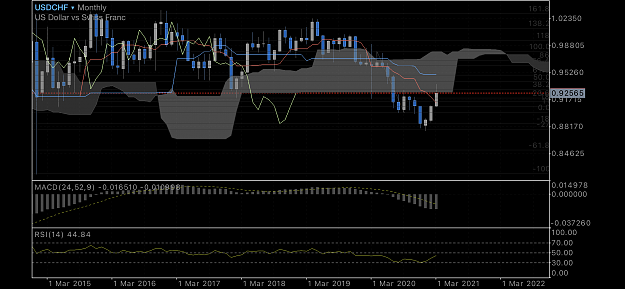
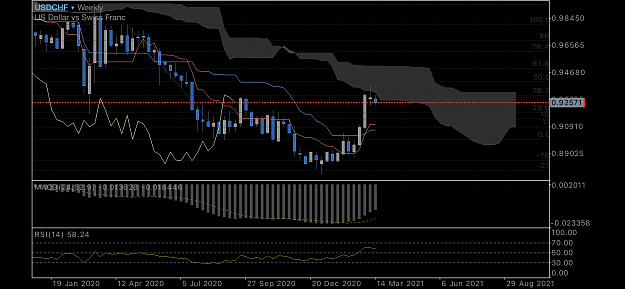
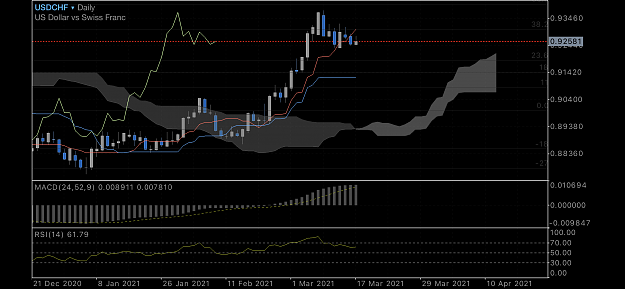
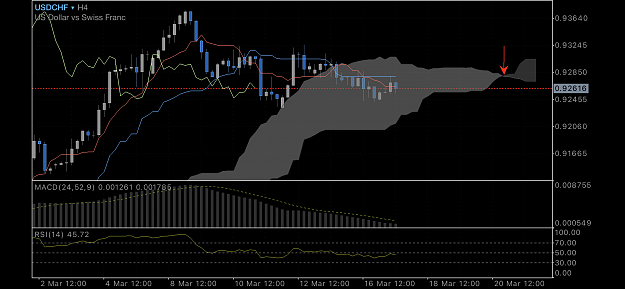
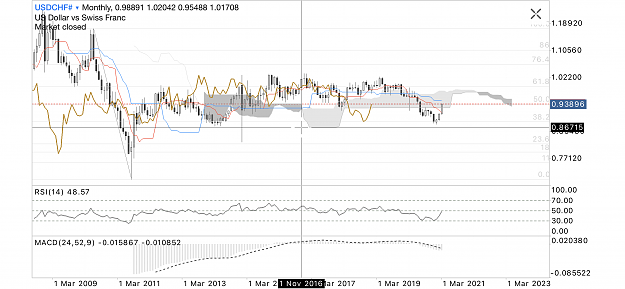
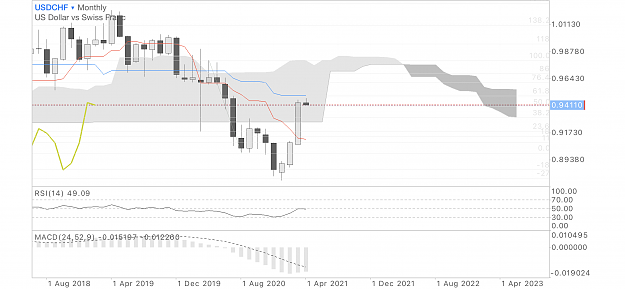
And for USDCHF all timeframes point to bearish continuation.
Nevertheless FOMC should incite to patient prudence.
Attached Image(s) (click to enlarge)
I used to be indecisive but now I'm not so sure...
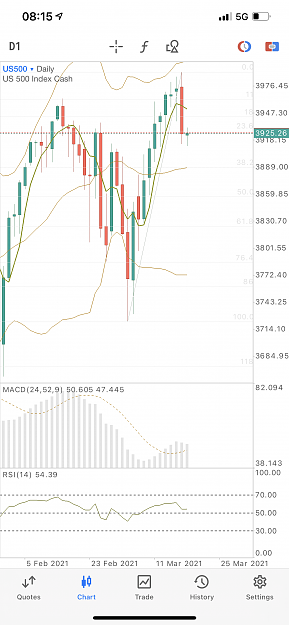
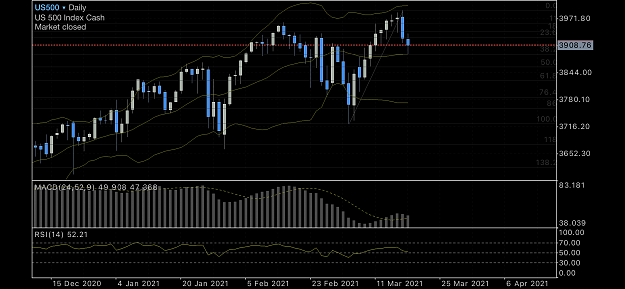
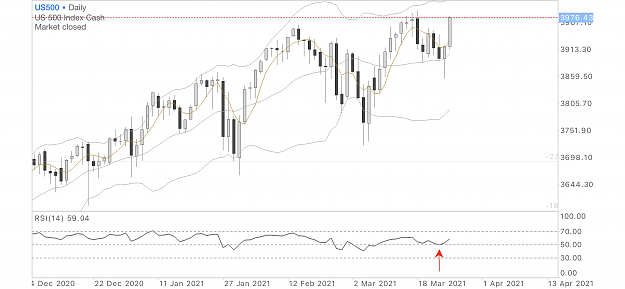
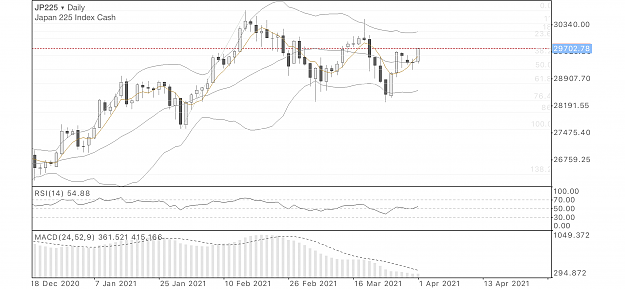
SP500 sent a signal with big bearish engulfing candlestick covering last 4 sessions and with an interesting divergence on MACD and RSI. {image}
Ignored
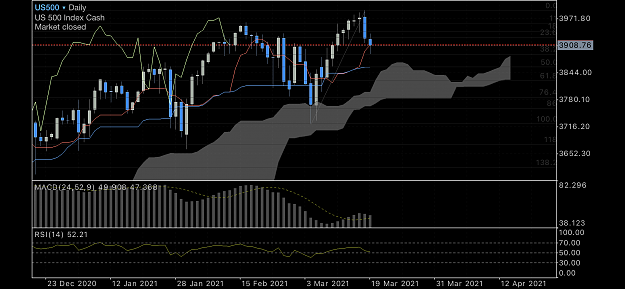
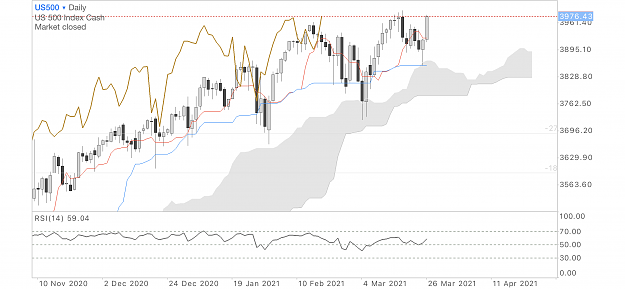
I would have preferred price action to close below the Bollinger middle band in confluence with 38.2 Fibonacci retracement and below Tenkan-sen on Ichimoku where the Lagging span was unable to cross below past candlesticks. Long wick coupled with RSI remaining above 50 and lack of bearish crossover on MACD are neither really engaging. We’ll see.
Attached Image(s) (click to enlarge)
I used to be indecisive but now I'm not so sure...
EURCHF trade is still alive according to the rules of this thread as stop-loss level has not been hit: high/low of the signalling candlestick +/-15 pips, represented with the golden rectangle in the chart below.
After the ranging rollercoaster seen on all CHF pairs recently it’s interesting to see how RSI is helping to filter out potential continuation patterns. Both March 16 and 22 bearish candlesticks closing well below Bollinger middle band have proven unreliable price action as RSI kept above 50. Now we just got an inverse signal but the rules defined on post #1 clearly discourage entering in position when the market is ranging sideways.
As we are getting close to month end a glimpse on the monthly Ichimoku chart is showing that the pair is retracing after hitting the former SSB line (upper cloud limit) extension.
Attached Image(s) (click to enlarge)
I used to be indecisive but now I'm not so sure...
{quote} We should always feel free to explore other indicators in search for a better perception of markets. If I use this system mainly to screen potential signals I like to check what Ichimoku Kinko Hyo has to say. And for USDCHF all timeframes point to bearish continuation. Nevertheless FOMC should incite to patient prudence. {image} {image} {image} {image}
Ignored
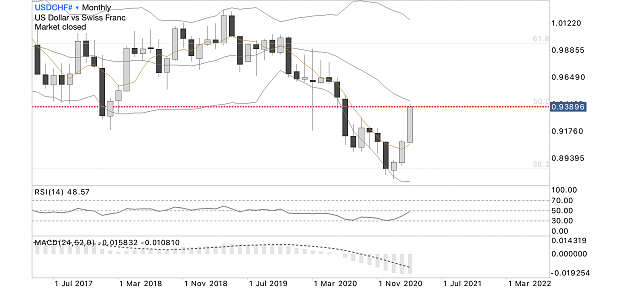
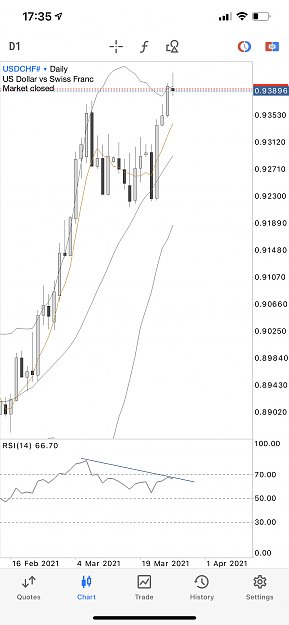
So USDCHF finally made it’s way to 0.9390 supported by the 10Y Treasury yield. Important to note that this level represents a major support/resistance at 50% retracement from the bearish trend seen between June 2010 and August 2011 which matches on Ichimoku monthly the extension of the SSB level between August 2015 and October 2016. Bollinger middle band stands just above adding more resistance and neither RSI nor MACD are in bullish territory. So bullish continuation appears quite uncertain. Now looking at the daily chart we have two important signals: the pin bar breaking the upper BB coupled with a bearish divergence on RSI. I will therefore enter short at the opening adding another position on SMA5 confirmation.
All the best.
Attached Image(s) (click to enlarge)
I used to be indecisive but now I'm not so sure...
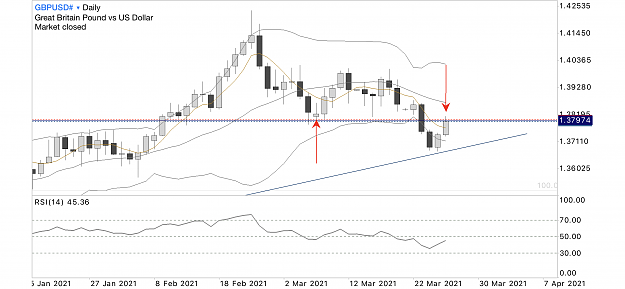
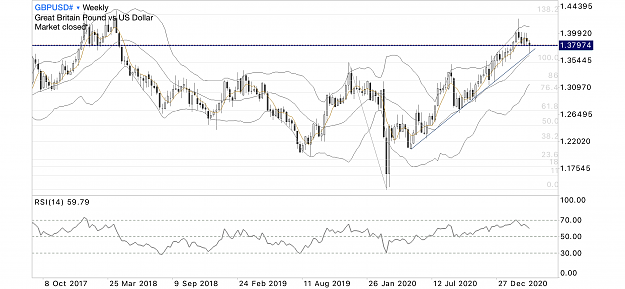
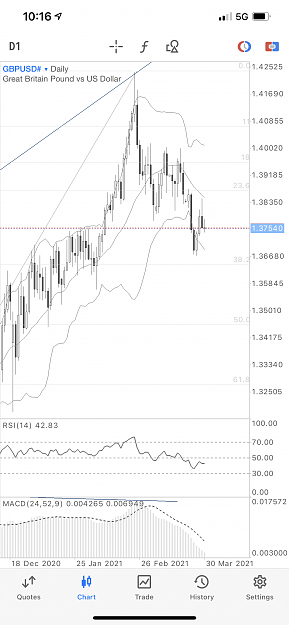
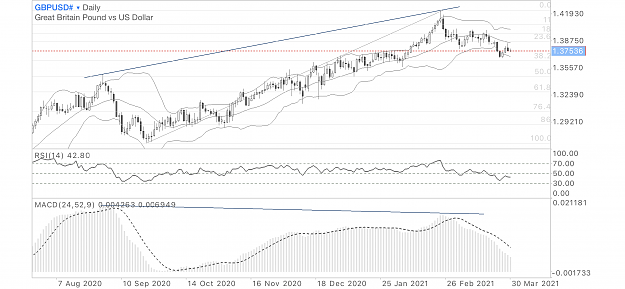
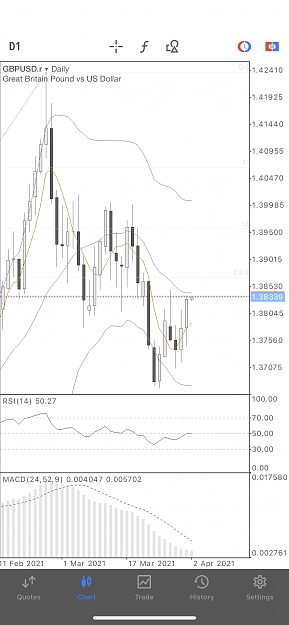
Bearish continuation likely for GBPUSD.
The pair just re-tested support/resistance line after breakout in reaction to contact with long term bullish trend line matching the weekly Bollinger middle band.
Attached Image(s) (click to enlarge)
I used to be indecisive but now I'm not so sure...
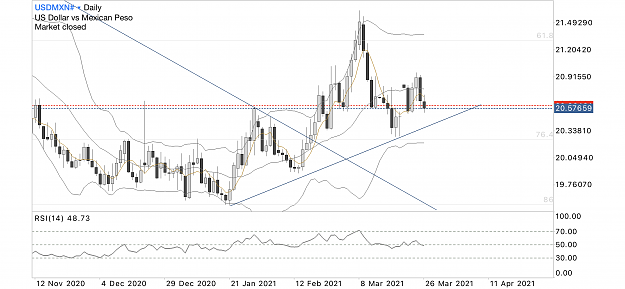
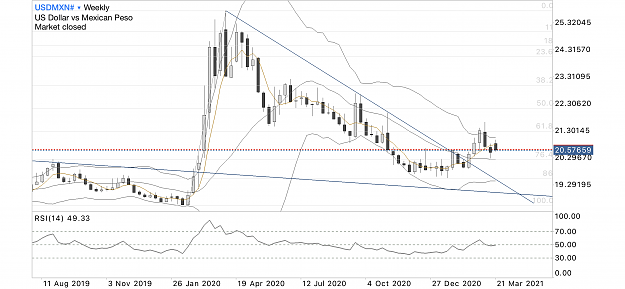
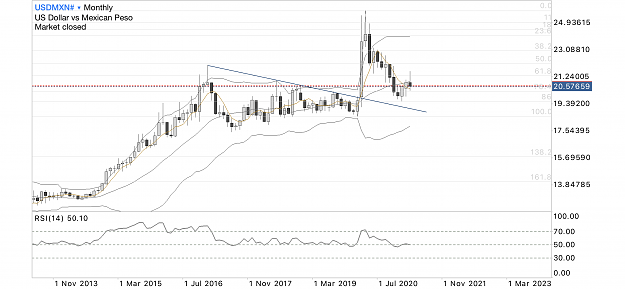
Bearish signal sent by USDMXN.
SMA5 pointing down just below Bollinger middle band after Thursday’s bearish engulfing candlestick. Only challenge: breaking through the support/resistance line at last closing level.
Out of this thread’s rules RSI below 50 on daily and weekly charts, and some interesting trend lines at play across the timeframes.
Attached Image(s) (click to enlarge)
I used to be indecisive but now I'm not so sure...
{quote} I would have preferred price action to close below the Bollinger middle band in confluence with 38.2 Fibonacci retracement and below Tenkan-sen on Ichimoku where the Lagging span was unable to cross below past candlesticks. Long wick coupled with RSI remaining above 50 and lack of bearish crossover on MACD are neither really engaging. We’ll see. {image} {image}
Ignored
Follow up on SP500. My doubts finally materialised with price action unable to close below Bollinger middle band after testing KS on Ichimoku. There again RSI did filter it correctly remaining in bullish territory above 50.
Attached Image(s) (click to enlarge)
I used to be indecisive but now I'm not so sure...
Hello everyone on this wonderful thread! Does someone know which is the correct answer to this question? You enter into a long (buy) CFD position with a total notional position value of $6,000 and a $300 margin requirement. You have an account balance of $10,000. What is the maximum amount that can be lost on this trade? possible answers - 0, 2000, 6000, 10000
Bearish continuation likely for GBPUSD. The pair just re-tested support/resistance line after breakout in reaction to contact with long term bullish trend line matching the weekly Bollinger middle band. {image} {image}
Ignored
Even better after rejection from Bollinger middle band.
{quote} So USDCHF finally made it’s way to 0.9390 supported by the 10Y Treasury yield. Important to note that this level represents a major support/resistance at 50% retracement from the bearish trend seen between June 2010 and August 2011 which matches on Ichimoku monthly the extension of the SSB level between August 2015 and October 2016. Bollinger middle band stands just above adding more resistance and neither RSI nor MACD are in bullish territory. So bullish continuation appears quite uncertain. Now looking at the daily chart we have two important...
Ignored
So this USDCHF failed to get confirmed by this strategy. No signal.
Attached Image(s) (click to enlarge)
I used to be indecisive but now I'm not so sure...
{quote} So USDCHF finally made it’s way to 0.9390 supported by the 10Y Treasury yield. Important to note that this level represents a major support/resistance at 50% retracement from the bearish trend seen between June 2010 and August 2011 which matches on Ichimoku monthly the extension of the SSB level between August 2015 and October 2016. Bollinger middle band stands just above adding more resistance and neither RSI nor MACD are in bullish territory. So bullish continuation appears quite uncertain. Now looking at the daily chart we have two important...
Ignored
The USDCHF saga is not over yet.
The pair proved unable to rise up to the flat Kijun Sen on the monthly Ichimoku chart matching with 61.8 retracement of the big memorable drop that occurred on Jan 15 2015.
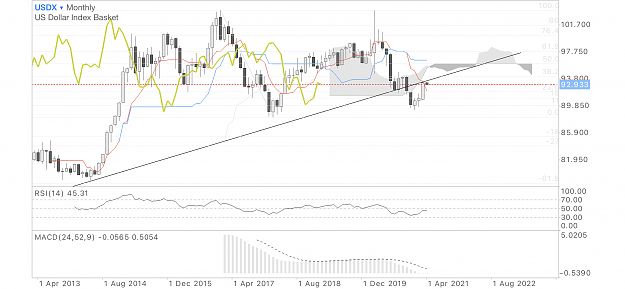
And if you look at the Dollar Index it’s currently struggling with the rising trendline now turned into resistance.
Attached Image(s) (click to enlarge)
I used to be indecisive but now I'm not so sure...
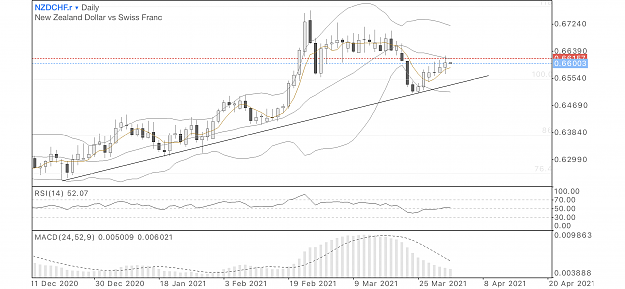
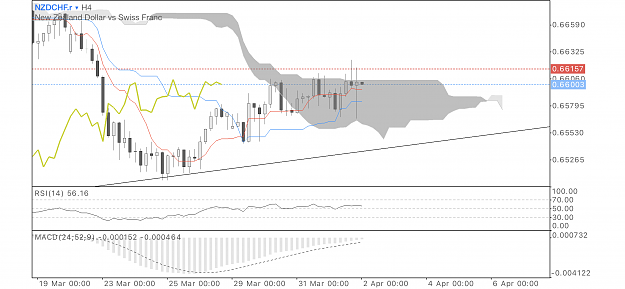
Careful with this signal on NZDCHF.
First it might be rejected from bearish Bollinger middle band and so far the pair has been unable to break through SSB on Ichimoku H4.
Attached Image(s) (click to enlarge)
I used to be indecisive but now I'm not so sure...
Bearish continuation likely for GBPUSD. The pair just re-tested support/resistance line after breakout in reaction to contact with long term bullish trend line matching the weekly Bollinger middle band. {image} {image}
Ignored
It has now sent a bullish signal, will price action break through Bollinger middle band? NFP tomorrow might give the answer.
Attached Image (click to enlarge)
I used to be indecisive but now I'm not so sure...