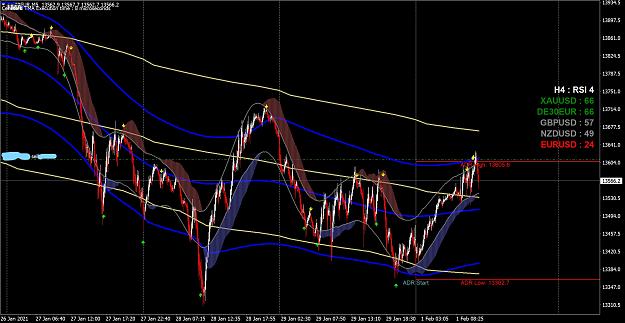
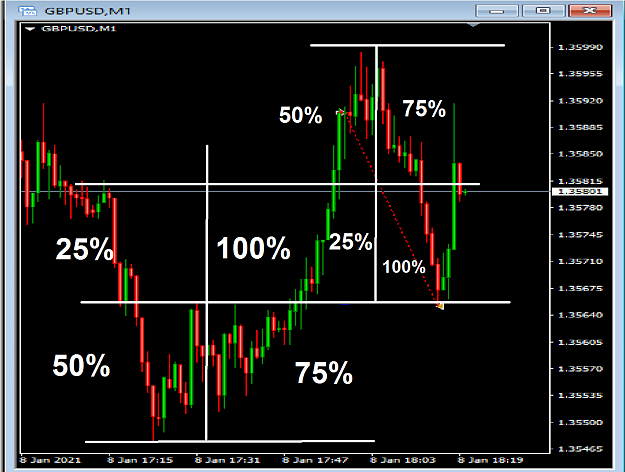
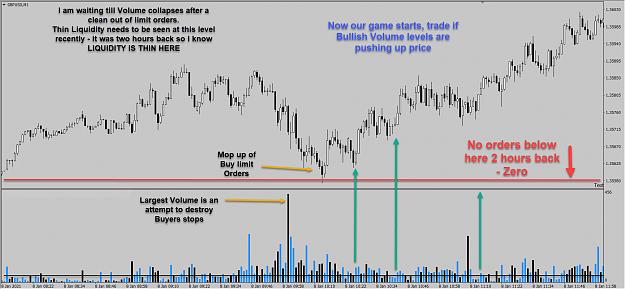
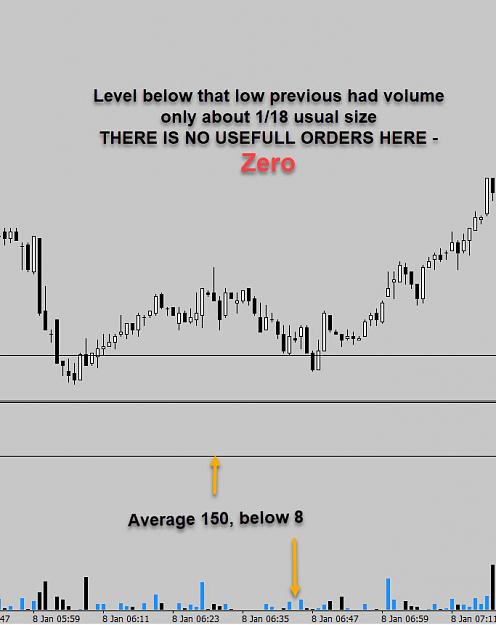
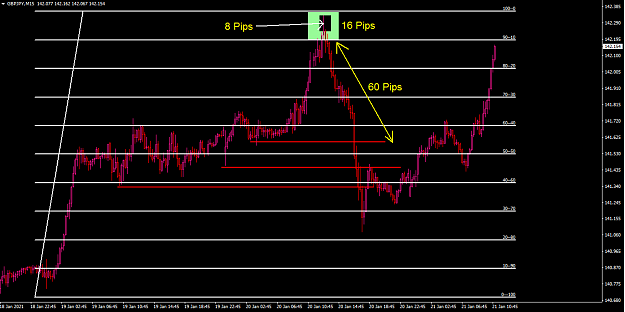
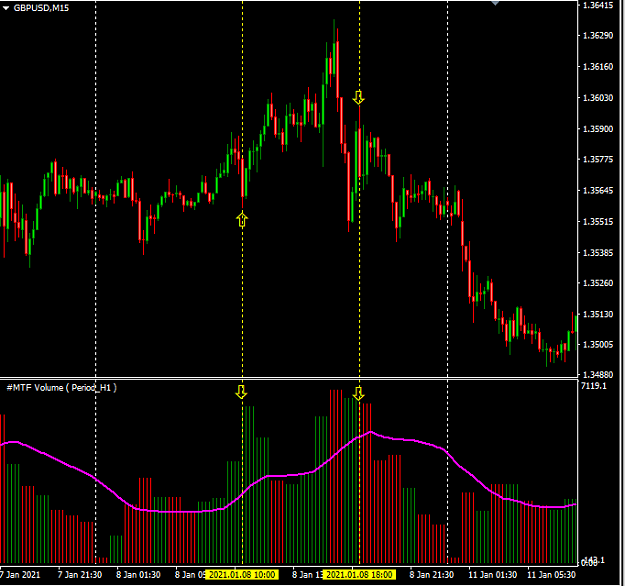
DislikedIf you're talking about the chart with the % marked on them, I have attached the lower TFs with volume. The pink lines represents the 2 trades taken that day. On both occurrences, the entry was on higher volume, relatively speaking. As seems to be the case most of the time, when there's a cluster of higher volume, it is often followed by a reaction / retracement in price. Generally speaking, I can't see how thin volume / liquidity can be a signal, as for a typical day that's when nothing happens, or in between session spikes. {image} {image}...Ignored
Attached Image (click to enlarge)
Trade the value
1