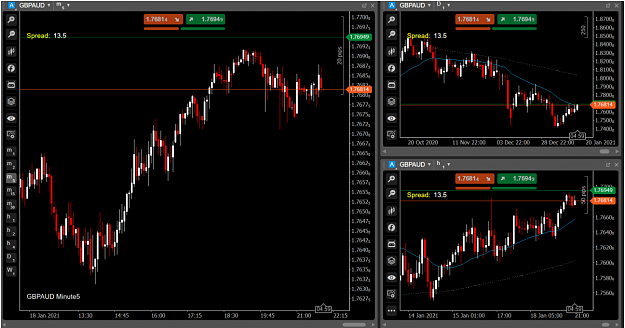
Disliked{quote} Interesting indicator, be good to know more about the settings It draws a pattern that I have noticed over the years, I call it an ' h ' pattern for obvious reasons Price drop to a level, then retraces in a rounding fashion, then stomps down and breaks through the level I know this is Price Action covered by support and resistance, impulsive and corrective, range and continuation, Fibonacci, and probably even more types of analysis but this indicator draws the line I typically only see these for short trades {image}Ignored
Oh yeah , Happy New Year Everyone
Trade what "Is", not what "If".